Skip to content

Geographic basemap methods (glyphs)#

The glyphs that plot geographic data — ArrayGlyph, MeshGlyph, VectorGlyph, FlowGlyph, PolygonGlyph, and ScatterGlyph — inherit cleopatra.geo.GeoMixin, which adds a settable crs property plus five convenience methods that drop a basemap onto the glyph's own axes without importing the standalone helpers:

  • crs — a validated coordinate-reference-system property (int EPSG code, CRS string, or None); it defaults the crs= of add_tiles / add_features when you omit it, and is validated on assignment.
  • add_tilescleopatra.tiles.add_tiles
  • add_featurescleopatra.reference.add_features
  • add_reliefcleopatra.reference.add_relief
  • add_reference_map — a one-call ECMWF/CAMS-style reference-map preset ("ecmwf", "ecmwf-dark", or "auto"): grey coastlines + borders, a dashed lon/lat graticule, °W/°N labels, and a subtle frame.
  • add_labelscleopatra.geo.add_point_labels (dot + text markers for named points, e.g. cities).

Each basemap method is a thin wrapper: it draws on self.ax (the axes produced when you plot the glyph) and forwards its arguments to the matching standalone function, which remains the single source of truth. Chart and statistical glyphs (LineGlyph, StatisticalGlyph, KDEGlyph) deliberately do not inherit these geo-only methods.

The module also exposes the standalone add_point_labels and available_map_styles functions and the REFERENCE_MAP_STYLES preset dict (copy or read it to build a custom preset).

Usage#

import matplotlib
matplotlib.use("Agg")  # any backend
import numpy as np

from cleopatra.scatter_glyph import ScatterGlyph

# A few cities as (lon, lat) points.
lon = np.array([-74.0, -0.1, 2.35, 13.4, 37.6, 139.7, 151.2])
lat = np.array([40.7, 51.5, 48.9, 52.5, 55.8, 35.7, -33.9])

glyph = ScatterGlyph(lon, lat, values=np.arange(len(lon)))
glyph.plot()                                       # plot your data first

glyph.add_features("coastline", "110m", colors="0.3")   # basemap, on glyph.ax
glyph.add_features("borders", "110m", colors="0.6")
glyph.ax.set_aspect("equal")                       # 1° lon == 1° lat
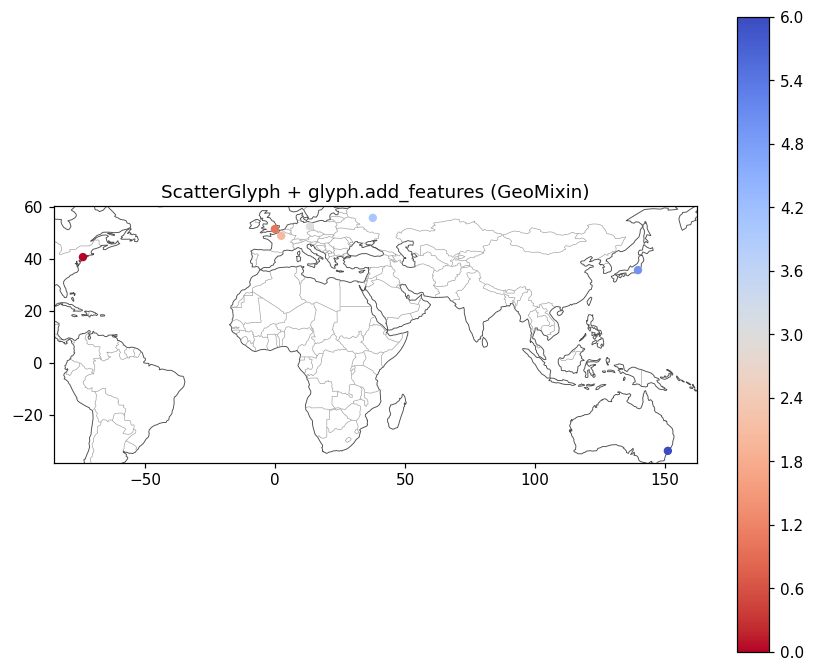
ScatterGlyph with coastline and borders via GeoMixin

The standalone functions still work for plain matplotlib axes or non-geographic glyphs:

import matplotlib.pyplot as plt

from cleopatra.reference import add_features

fig, ax = plt.subplots()        # any matplotlib Axes
ax.set_xlim(-180, 180)
ax.set_ylim(-90, 90)
ax.set_aspect("equal")
add_features(ax, "coastline", "110m")

Note

Call these after plotting (so the glyph has an axes), or pass an explicit ax=. add_relief and crs= reprojection require the cleopatra[tiles] extra; drawing vector layers in EPSG:4326 needs only numpy + matplotlib.

Module Documentation#

cleopatra.geo #

Geographic basemap convenience methods for glyphs.

GeoMixin adds three convenience methods -- add_tiles, add_features, and add_relief -- to the glyph classes that plot geographic data, so a basemap can be dropped under a plot without importing the standalone helpers and without repeating the axes:

>>> glyph.plot()                 # doctest: +SKIP
>>> glyph.add_relief("low")      # doctest: +SKIP
>>> glyph.add_features("coastline", "50m")  # doctest: +SKIP

Each method is a thin wrapper that draws on the glyph's own axes (self.ax) and delegates to the single implementation in cleopatra.tiles / cleopatra.reference. The standalone functions remain the source of truth; this mixin only removes the import + explicit-axes boilerplate for the geographic glyphs (ArrayGlyph, MeshGlyph, VectorGlyph, FlowGlyph, PolygonGlyph, ScatterGlyph). Non-geographic glyphs (line/bar charts, statistical plots) deliberately do not inherit it.

Importing this module (and the cleopatra.tiles / cleopatra.reference modules it calls) does not require the optional cleopatra[tiles] extra: those modules gate their [tiles] dependencies (mercantile, pyproj, Pillow, ...) behind their own internal lazy imports, so the extra is only needed when a basemap is actually drawn.

GeoMixin #

Mixin giving geographic glyphs add_tiles / add_features / add_relief.

The host class is expected to expose the plotted axes as self.ax (every cleopatra.glyph.Glyph subclass does). Call these after plotting, or pass ax= explicitly.

Set self.crs to the CRS of the data plotted on the axes (an EPSG code or CRS string) and add_features / add_tiles default their crs= argument to it, so the reference layer is placed in matching coordinates without restating it on every call. An explicit crs= still wins; leaving self.crs as None preserves each helper's own default. add_relief ignores crs -- relief is a fixed EPSG:4326 raster placed by extent.

Source code in src/cleopatra/geo.py
321
322
323
324
325
326
327
328
329
330
331
332
333
334
335
336
337
338
339
340
341
342
343
344
345
346
347
348
349
350
351
352
353
354
355
356
357
358
359
360
361
362
363
364
365
366
367
368
369
370
371
372
373
374
375
376
377
378
379
380
381
382
383
384
385
386
387
388
389
390
391
392
393
394
395
396
397
398
399
400
401
402
403
404
405
406
407
408
409
410
411
412
413
414
415
416
417
418
419
420
421
422
423
424
425
426
427
428
429
430
431
432
433
434
435
436
437
438
439
440
441
442
443
444
445
446
447
448
449
450
451
452
453
454
455
456
457
458
459
460
461
462
463
464
465
466
467
468
469
470
471
472
473
474
475
476
477
478
479
480
481
482
483
484
485
486
487
488
489
490
491
492
493
494
495
496
497
498
499
500
501
502
503
504
505
506
507
508
509
510
511
512
513
514
515
516
517
518
519
520
521
522
523
524
525
526
527
528
529
530
531
532
533
534
535
536
537
538
539
540
541
542
543
544
545
546
547
548
549
550
551
552
553
554
555
556
557
558
559
560
561
562
563
564
565
566
567
568
569
570
571
572
573
574
575
576
577
578
579
580
581
582
583
584
585
586
587
588
589
590
591
592
593
594
595
596
597
598
599
600
601
602
603
604
605
606
607
608
609
610
611
612
613
614
615
616
617
618
619
620
621
622
623
624
625
626
627
628
629
630
631
632
633
634
635
636
637
638
639
640
641
642
643
644
645
646
647
648
649
650
651
652
653
654
655
656
657
658
659
660
661
662
663
664
665
666
667
668
669
670
671
672
673
674
675
676
677
678
679
680
681
682
683
684
685
686
687
688
689
690
691
692
693
694
695
696
697
698
699
700
701
702
703
704
705
706
707
708
709
710
711
class GeoMixin:
    """Mixin giving geographic glyphs `add_tiles` / `add_features` / `add_relief`.

    The host class is expected to expose the plotted axes as `self.ax`
    (every `cleopatra.glyph.Glyph` subclass does). Call these after
    plotting, or pass `ax=` explicitly.

    Set `self.crs` to the CRS of the data plotted on the axes (an EPSG code
    or CRS string) and `add_features` / `add_tiles` default their `crs=`
    argument to it, so the reference layer is placed in matching
    coordinates without restating it on every call. An explicit `crs=`
    still wins; leaving `self.crs` as `None` preserves each helper's own
    default. `add_relief` ignores `crs` -- relief is a fixed EPSG:4326
    raster placed by `extent`.
    """

    #: Set by `cleopatra.glyph.Glyph`; the axes the basemap is drawn on.
    ax: Any

    #: Backing store for the validated `crs` property; `None` means unset.
    _crs: int | str | None = None

    @property
    def crs(self) -> int | str | None:
        """CRS of the data plotted on `self.ax` (EPSG code or CRS string).

        When set, `add_features` / `add_tiles` default `crs=` to it; `None`
        keeps each helper's own default. The value is **validated on
        assignment** (see `cleopatra.geo._validate_crs`) so mistakes surface
        at `glyph.crs = ...` rather than later, when a basemap is drawn.

        Raises:
            TypeError: If assigned something other than an int, str, or
                `None`.
            ValueError: If assigned a non-positive EPSG code, an empty
                string, or (when `pyproj` is installed) an unresolvable CRS.
        """
        return self._crs

    @crs.setter
    def crs(self, value: int | str | None) -> None:
        self._crs = _validate_crs(value)

    def _basemap_axes(self, ax: Any = None) -> Any:
        """Return the axes to draw a basemap on (`ax` or `self.ax`).

        Args:
            ax: An explicit axes to use instead of the glyph's own.

        Returns:
            The resolved matplotlib axes.

        Raises:
            RuntimeError: If neither `ax` nor `self.ax` is available -- the
                glyph has not been plotted yet.
        """
        target = ax if ax is not None else getattr(self, "ax", None)
        if target is None:
            raise RuntimeError(
                "No axes to draw on. Plot the glyph first (or pass ax=) "
                "before adding a basemap layer."
            )
        return target

    def _basemap_kwargs(self, kwargs: dict) -> dict:
        """Default `crs` to `self.crs` when the caller did not set it.

        Only injects when `self.crs` is set and `crs` is absent (or `None`)
        in `kwargs`, so the default `self.crs is None` is a pure pass-through
        and an explicit `crs=` always wins. `crs` is keyword-only in both
        `add_features` and `add_tiles`, so it always arrives via `kwargs`.

        Args:
            kwargs: The keyword arguments destined for the basemap helper.

        Returns:
            dict: `kwargs`, with `crs` filled in from `self.crs` when needed.
        """
        if self.crs is not None and kwargs.get("crs") is None:
            return {**kwargs, "crs": self.crs}
        return kwargs

    def add_tiles(self, *args: Any, ax: Any = None, **kwargs: Any) -> Any:
        """Overlay a web-tile basemap on the glyph's axes.

        Thin wrapper over `cleopatra.tiles.add_tiles`; positional and
        keyword arguments are forwarded unchanged (e.g. `source`, `crs`,
        `zoom`, `alpha`). When `crs` is omitted it defaults to `self.crs`.
        Requires the `cleopatra[tiles]` extra.

        Args:
            *args: Positional arguments for `cleopatra.tiles.add_tiles`
                (after the axes).
            ax: Axes to draw on. Defaults to the glyph's `self.ax`.
            **kwargs: Keyword arguments for `cleopatra.tiles.add_tiles`. A
                `crs` keyword is defaulted to `self.crs` when omitted; an
                explicit `crs=` overrides it.

        Returns:
            matplotlib.axes.Axes: The axes, for chaining.

        Raises:
            RuntimeError: If the glyph has no axes yet and `ax` is not given.

        See Also:
            cleopatra.tiles.add_tiles: The underlying implementation and its
                full parameter list.
        """
        return tiles.add_tiles(
            self._basemap_axes(ax), *args, **self._basemap_kwargs(kwargs)
        )

    def add_features(self, *args: Any, ax: Any = None, **kwargs: Any) -> Any:
        """Draw a Natural Earth reference layer on the glyph's axes.

        Thin wrapper over `cleopatra.reference.add_features`; arguments are
        forwarded unchanged (e.g. `layer`, `resolution`, `crs`, and style
        keywords). When `crs` is omitted it defaults to `self.crs`.

        Args:
            *args: Positional arguments for
                `cleopatra.reference.add_features` (after the axes), such as
                `layer` and `resolution`.
            ax: Axes to draw on. Defaults to the glyph's `self.ax`.
            **kwargs: Keyword arguments for
                `cleopatra.reference.add_features`. A `crs` keyword is
                defaulted to `self.crs` when omitted; an explicit `crs=`
                overrides it.

        Returns:
            matplotlib.axes.Axes: The axes, for chaining.

        Raises:
            RuntimeError: If the glyph has no axes yet and `ax` is not given.

        See Also:
            cleopatra.reference.add_features: The underlying implementation
                and its full parameter list.
        """
        return reference.add_features(
            self._basemap_axes(ax), *args, **self._basemap_kwargs(kwargs)
        )

    def add_relief(self, *args: Any, ax: Any = None, **kwargs: Any) -> Any:
        """Draw a hypsometric relief backdrop under the glyph's data.

        Thin wrapper over `cleopatra.reference.add_relief`; arguments are
        forwarded unchanged (e.g. `resolution`, `extent`, `alpha`).
        Requires the `cleopatra[tiles]` extra (Pillow).

        Args:
            *args: Positional arguments for
                `cleopatra.reference.add_relief` (after the axes), such as
                `resolution`.
            ax: Axes to draw on. Defaults to the glyph's `self.ax`.
            **kwargs: Keyword arguments for
                `cleopatra.reference.add_relief`.

        Returns:
            matplotlib.axes.Axes: The axes, for chaining.

        Raises:
            RuntimeError: If the glyph has no axes yet and `ax` is not given.

        See Also:
            cleopatra.reference.add_relief: The underlying implementation and
                its full parameter list.
        """
        return reference.add_relief(self._basemap_axes(ax), *args, **kwargs)

    def add_labels(
        self, points: dict[str, tuple[float, float]], *, ax: Any = None, **kwargs: Any
    ) -> Any:
        """Annotate named points on the glyph's axes with a dot + label.

        Thin wrapper over `cleopatra.geo.add_point_labels`; draws a plain
        dot marker and text label per point, matching the minimalist
        city-label look ECMWF/CAMS maps use. Points are plotted at whatever
        coordinates the axes is already using -- plain lon/lat for a flat
        map, or reprojected x/y for an orthographic globe.

        Args:
            points: Mapping of label text to `(x, y)` coordinates, in the
                same coordinate space as whatever is already plotted on the
                axes.
            ax: Axes to draw on. Defaults to the glyph's `self.ax`.
            **kwargs: Forwarded to `cleopatra.geo.add_point_labels` (e.g.
                `color`, `marker_size`, `fontsize`, `offset`, `zorder`).

        Returns:
            matplotlib.axes.Axes: The axes, for chaining.

        Raises:
            RuntimeError: If the glyph has no axes yet and `ax` is not given.

        Examples:
            - Label a city on a plotted glyph:
                ```python
                >>> import numpy as np
                >>> from cleopatra.array_glyph import ArrayGlyph
                >>> data = np.random.rand(20, 30)
                >>> glyph = ArrayGlyph(data, extent=[-100, 15, -40, 55])
                >>> fig, ax = glyph.plot()  # doctest: +SKIP
                >>> glyph.add_labels({"London": (-0.1, 51.5)})  # doctest: +SKIP

                ```

        See Also:
            cleopatra.geo.add_point_labels: The underlying implementation.
            add_reference_map: The full basemap-chrome preset this pairs with.
        """
        return add_point_labels(self._basemap_axes(ax), points, **kwargs)

    def _background_is_dark(self, ax: Any) -> bool:
        """Whether the field displayed on `ax` reads as a dark background.

        Used only by `add_reference_map(style="auto")`. Samples an image on
        the target `ax` (falling back to the glyph's own `self.im`) and runs
        it through `im.to_rgba(...)`, which applies the colormap and `norm`
        for a colormapped scalar field and passes an RGB(A) frame through, so
        the decision reflects the *displayed* colours (mean Rec. 709
        luminance) rather than raw data magnitude. Only **opaque** cells are
        counted: masked / no-data cells render to the colormap's transparent
        "bad" colour and are excluded, so a light field that merely has a lot
        of no-data is not misread as dark. Large fields are decimated to keep
        the check O(1) in memory. Returns `False` when there is nothing
        opaque to sample (a neutral default).

        Args:
            ax: The axes being decorated. An image drawn on it is preferred
                as the sample source; otherwise `self.im` is used.

        Returns:
            bool: `True` when the mean displayed luminance is below 0.5.
        """
        images = ax.get_images() if ax is not None and hasattr(ax, "get_images") else []
        im = images[-1] if images else getattr(self, "im", None)
        arr = im.get_array() if im is not None and hasattr(im, "get_array") else None
        if arr is None:
            return False
        # Decimate so the decision costs O(1) memory on large rasters.
        if getattr(arr, "ndim", 0) >= 2:
            sy = max(1, arr.shape[0] // 256)
            sx = max(1, arr.shape[1] // 256)
            arr = arr[::sy, ::sx]
        # Render through the image's norm+colormap so a colormapped field is
        # judged by what is shown, not by its data units; RGB(A) passes through.
        rgba = np.asarray(im.to_rgba(arr), dtype=float)
        if rgba.size == 0:
            return False
        rgb, alpha = rgba[..., :3], rgba[..., 3]
        opaque = alpha > 0
        if not opaque.any():
            return False
        lum = 0.2126 * rgb[..., 0] + 0.7152 * rgb[..., 1] + 0.0722 * rgb[..., 2]
        return bool(np.mean(lum[opaque]) < 0.5)

    def add_reference_map(
        self,
        style: str = "ecmwf",
        *,
        ax: Any = None,
        extent: Any = None,
        resolution: str | None = None,
        graticule_step: float | None = None,
        zorder: int = 5,
    ) -> Any:
        """Dress the glyph's axes in a weather-centre reference-map style.

        One call composes the recipe that otherwise takes ~15 lines of
        matplotlib after `plot`/`animate`: grey Natural Earth `coastline`
        + `borders`, a dashed lon/lat graticule, `°W`/`°N` degree labels,
        and a subtle frame. It layers on top of the existing data, so call
        it after plotting.

        The map is drawn in the axes' current geographic coordinates. Pass
        `extent` (or construct the glyph with `extent=`) so the axes are
        georeferenced — otherwise the coastlines cannot align with the data
        and a warning is emitted. Deriving that extent from a source dataset
        is the caller's job (cleopatra renders supplied coordinates; it does
        not read geotransforms).

        Args:
            style: A name from `available_map_styles()` (`"ecmwf"`,
                `"ecmwf-dark"`), or `"auto"` to pick between them from the
                background luminance (dark backgrounds get the lighter
                `"ecmwf-dark"` greys so coastlines stay visible). Default
                `"ecmwf"`.
            ax: Axes to draw on. Defaults to the glyph's `self.ax`.
            extent: Optional `[xmin, ymin, xmax, ymax]` (i.e.
                `[west, south, east, north]`) in the axes' CRS -- the same
                order as `ArrayGlyph(extent=...)`. When given, the image and
                axis limits are set to it (handling the pixel-coordinate
                RGB/animate case); when omitted the current axis limits are
                used.
            resolution: Natural Earth resolution for the coastline/borders
                (`"110m"`/`"50m"`/`"10m"`). Defaults to the style's value.
            graticule_step: Degree spacing for the graticule. Defaults to a
                "nice" step giving ~6 divisions across the wider span.
            zorder: Draw order for the reference layers (drawn above the
                data; the graticule sits just below the coastlines).

        Returns:
            matplotlib.axes.Axes: The decorated axes, for chaining.

        Raises:
            RuntimeError: If the glyph has no axes yet and `ax` is not given.
            ValueError: If `style` is not a known preset or `"auto"`, or if
                `graticule_step` is given and is not a positive number.

        Examples:
            - Dress a georeferenced field in the ECMWF look:
                ```python
                >>> import numpy as np
                >>> from cleopatra.array_glyph import ArrayGlyph
                >>> data = np.random.rand(20, 30)
                >>> glyph = ArrayGlyph(data, extent=[-100, 15, -40, 55])
                >>> fig, ax = glyph.plot()  # doctest: +SKIP
                >>> glyph.add_reference_map("ecmwf")  # doctest: +SKIP

                ```

        See Also:
            add_features: The Natural Earth layer helper this composes.
            available_map_styles: The built-in preset names.
        """
        if graticule_step is not None and (
            not math.isfinite(graticule_step) or graticule_step <= 0
        ):
            raise ValueError(
                "graticule_step must be a positive, finite number, got "
                f"{graticule_step}"
            )
        target = self._basemap_axes(ax)

        resolved = style
        if style == "auto":
            resolved = "ecmwf-dark" if self._background_is_dark(target) else "ecmwf"
        if resolved not in REFERENCE_MAP_STYLES:
            raise ValueError(
                f"Unknown map style {style!r}; available: "
                f"{available_map_styles()} (or 'auto')."
            )
        preset = REFERENCE_MAP_STYLES[resolved]

        if extent is not None:
            # `[xmin, ymin, xmax, ymax]` == `[west, south, east, north]`,
            # the same order as ArrayGlyph(extent=...); matplotlib wants
            # `(xmin, xmax, ymin, ymax)` for `set_extent`.
            if len(extent) != 4:
                raise ValueError(
                    "extent must be [xmin, ymin, xmax, ymax] "
                    f"(4 values), got {len(extent)}"
                )
            west, south, east, north = extent
            im = getattr(self, "im", None)
            if im is not None and hasattr(im, "set_extent"):
                im.set_extent((west, east, south, north))
            target.set_xlim(west, east)
            target.set_ylim(south, north)
        elif getattr(self, "extent", None) is None:
            warnings.warn(
                "add_reference_map: the glyph has no geographic extent, so "
                "coastlines/borders may not align with the data. Pass "
                "extent=[west, south, east, north] or construct the glyph "
                "with extent=.",
                stacklevel=2,
            )

        res = resolution or preset["resolution"]
        self.add_features(
            "coastline", res, ax=target, zorder=zorder, **preset["coastline"]
        )
        self.add_features("borders", res, ax=target, zorder=zorder, **preset["borders"])

        xmin, xmax = target.get_xlim()
        ymin, ymax = target.get_ylim()
        step = (
            graticule_step
            if graticule_step is not None
            else _nice_step(max(abs(xmax - xmin), abs(ymax - ymin)))
        )
        target.xaxis.set_major_locator(MultipleLocator(step))
        target.yaxis.set_major_locator(MultipleLocator(step))
        target.xaxis.set_major_formatter(FuncFormatter(_lon_formatter))
        target.yaxis.set_major_formatter(FuncFormatter(_lat_formatter))
        target.grid(True, zorder=zorder - 1, **preset["graticule"])
        target.tick_params(length=0, **preset["labels"])
        for spine in target.spines.values():
            spine.set(**preset["spines"])
        return target
crs property writable #

CRS of the data plotted on self.ax (EPSG code or CRS string).

When set, add_features / add_tiles default crs= to it; None keeps each helper's own default. The value is validated on assignment (see cleopatra.geo._validate_crs) so mistakes surface at glyph.crs = ... rather than later, when a basemap is drawn.

Raises:

Type Description
TypeError

If assigned something other than an int, str, or None.

ValueError

If assigned a non-positive EPSG code, an empty string, or (when pyproj is installed) an unresolvable CRS.

add_features(*args, ax=None, **kwargs) #

Draw a Natural Earth reference layer on the glyph's axes.

Thin wrapper over cleopatra.reference.add_features; arguments are forwarded unchanged (e.g. layer, resolution, crs, and style keywords). When crs is omitted it defaults to self.crs.

Parameters:

Name Type Description Default
*args Any

Positional arguments for cleopatra.reference.add_features (after the axes), such as layer and resolution.

()
ax Any

Axes to draw on. Defaults to the glyph's self.ax.

None
**kwargs Any

Keyword arguments for cleopatra.reference.add_features. A crs keyword is defaulted to self.crs when omitted; an explicit crs= overrides it.

{}

Returns:

Type Description
Any

matplotlib.axes.Axes: The axes, for chaining.

Raises:

Type Description
RuntimeError

If the glyph has no axes yet and ax is not given.

See Also

cleopatra.reference.add_features: The underlying implementation and its full parameter list.

Source code in src/cleopatra/geo.py
def add_features(self, *args: Any, ax: Any = None, **kwargs: Any) -> Any:
    """Draw a Natural Earth reference layer on the glyph's axes.

    Thin wrapper over `cleopatra.reference.add_features`; arguments are
    forwarded unchanged (e.g. `layer`, `resolution`, `crs`, and style
    keywords). When `crs` is omitted it defaults to `self.crs`.

    Args:
        *args: Positional arguments for
            `cleopatra.reference.add_features` (after the axes), such as
            `layer` and `resolution`.
        ax: Axes to draw on. Defaults to the glyph's `self.ax`.
        **kwargs: Keyword arguments for
            `cleopatra.reference.add_features`. A `crs` keyword is
            defaulted to `self.crs` when omitted; an explicit `crs=`
            overrides it.

    Returns:
        matplotlib.axes.Axes: The axes, for chaining.

    Raises:
        RuntimeError: If the glyph has no axes yet and `ax` is not given.

    See Also:
        cleopatra.reference.add_features: The underlying implementation
            and its full parameter list.
    """
    return reference.add_features(
        self._basemap_axes(ax), *args, **self._basemap_kwargs(kwargs)
    )
add_labels(points, *, ax=None, **kwargs) #

Annotate named points on the glyph's axes with a dot + label.

Thin wrapper over cleopatra.geo.add_point_labels; draws a plain dot marker and text label per point, matching the minimalist city-label look ECMWF/CAMS maps use. Points are plotted at whatever coordinates the axes is already using -- plain lon/lat for a flat map, or reprojected x/y for an orthographic globe.

Parameters:

Name Type Description Default
points dict[str, tuple[float, float]]

Mapping of label text to (x, y) coordinates, in the same coordinate space as whatever is already plotted on the axes.

required
ax Any

Axes to draw on. Defaults to the glyph's self.ax.

None
**kwargs Any

Forwarded to cleopatra.geo.add_point_labels (e.g. color, marker_size, fontsize, offset, zorder).

{}

Returns:

Type Description
Any

matplotlib.axes.Axes: The axes, for chaining.

Raises:

Type Description
RuntimeError

If the glyph has no axes yet and ax is not given.

Examples:

  • Label a city on a plotted glyph:
    >>> import numpy as np
    >>> from cleopatra.array_glyph import ArrayGlyph
    >>> data = np.random.rand(20, 30)
    >>> glyph = ArrayGlyph(data, extent=[-100, 15, -40, 55])
    >>> fig, ax = glyph.plot()  # doctest: +SKIP
    >>> glyph.add_labels({"London": (-0.1, 51.5)})  # doctest: +SKIP
    
See Also

cleopatra.geo.add_point_labels: The underlying implementation. add_reference_map: The full basemap-chrome preset this pairs with.

Source code in src/cleopatra/geo.py
def add_labels(
    self, points: dict[str, tuple[float, float]], *, ax: Any = None, **kwargs: Any
) -> Any:
    """Annotate named points on the glyph's axes with a dot + label.

    Thin wrapper over `cleopatra.geo.add_point_labels`; draws a plain
    dot marker and text label per point, matching the minimalist
    city-label look ECMWF/CAMS maps use. Points are plotted at whatever
    coordinates the axes is already using -- plain lon/lat for a flat
    map, or reprojected x/y for an orthographic globe.

    Args:
        points: Mapping of label text to `(x, y)` coordinates, in the
            same coordinate space as whatever is already plotted on the
            axes.
        ax: Axes to draw on. Defaults to the glyph's `self.ax`.
        **kwargs: Forwarded to `cleopatra.geo.add_point_labels` (e.g.
            `color`, `marker_size`, `fontsize`, `offset`, `zorder`).

    Returns:
        matplotlib.axes.Axes: The axes, for chaining.

    Raises:
        RuntimeError: If the glyph has no axes yet and `ax` is not given.

    Examples:
        - Label a city on a plotted glyph:
            ```python
            >>> import numpy as np
            >>> from cleopatra.array_glyph import ArrayGlyph
            >>> data = np.random.rand(20, 30)
            >>> glyph = ArrayGlyph(data, extent=[-100, 15, -40, 55])
            >>> fig, ax = glyph.plot()  # doctest: +SKIP
            >>> glyph.add_labels({"London": (-0.1, 51.5)})  # doctest: +SKIP

            ```

    See Also:
        cleopatra.geo.add_point_labels: The underlying implementation.
        add_reference_map: The full basemap-chrome preset this pairs with.
    """
    return add_point_labels(self._basemap_axes(ax), points, **kwargs)
add_reference_map(style='ecmwf', *, ax=None, extent=None, resolution=None, graticule_step=None, zorder=5) #

Dress the glyph's axes in a weather-centre reference-map style.

One call composes the recipe that otherwise takes ~15 lines of matplotlib after plot/animate: grey Natural Earth coastline + borders, a dashed lon/lat graticule, °W/°N degree labels, and a subtle frame. It layers on top of the existing data, so call it after plotting.

The map is drawn in the axes' current geographic coordinates. Pass extent (or construct the glyph with extent=) so the axes are georeferenced — otherwise the coastlines cannot align with the data and a warning is emitted. Deriving that extent from a source dataset is the caller's job (cleopatra renders supplied coordinates; it does not read geotransforms).

Parameters:

Name Type Description Default
style str

A name from available_map_styles() ("ecmwf", "ecmwf-dark"), or "auto" to pick between them from the background luminance (dark backgrounds get the lighter "ecmwf-dark" greys so coastlines stay visible). Default "ecmwf".

'ecmwf'
ax Any

Axes to draw on. Defaults to the glyph's self.ax.

None
extent Any

Optional [xmin, ymin, xmax, ymax] (i.e. [west, south, east, north]) in the axes' CRS -- the same order as ArrayGlyph(extent=...). When given, the image and axis limits are set to it (handling the pixel-coordinate RGB/animate case); when omitted the current axis limits are used.

None
resolution str | None

Natural Earth resolution for the coastline/borders ("110m"/"50m"/"10m"). Defaults to the style's value.

None
graticule_step float | None

Degree spacing for the graticule. Defaults to a "nice" step giving ~6 divisions across the wider span.

None
zorder int

Draw order for the reference layers (drawn above the data; the graticule sits just below the coastlines).

5

Returns:

Type Description
Any

matplotlib.axes.Axes: The decorated axes, for chaining.

Raises:

Type Description
RuntimeError

If the glyph has no axes yet and ax is not given.

ValueError

If style is not a known preset or "auto", or if graticule_step is given and is not a positive number.

Examples:

  • Dress a georeferenced field in the ECMWF look:
    >>> import numpy as np
    >>> from cleopatra.array_glyph import ArrayGlyph
    >>> data = np.random.rand(20, 30)
    >>> glyph = ArrayGlyph(data, extent=[-100, 15, -40, 55])
    >>> fig, ax = glyph.plot()  # doctest: +SKIP
    >>> glyph.add_reference_map("ecmwf")  # doctest: +SKIP
    
See Also

add_features: The Natural Earth layer helper this composes. available_map_styles: The built-in preset names.

Source code in src/cleopatra/geo.py
def add_reference_map(
    self,
    style: str = "ecmwf",
    *,
    ax: Any = None,
    extent: Any = None,
    resolution: str | None = None,
    graticule_step: float | None = None,
    zorder: int = 5,
) -> Any:
    """Dress the glyph's axes in a weather-centre reference-map style.

    One call composes the recipe that otherwise takes ~15 lines of
    matplotlib after `plot`/`animate`: grey Natural Earth `coastline`
    + `borders`, a dashed lon/lat graticule, `°W`/`°N` degree labels,
    and a subtle frame. It layers on top of the existing data, so call
    it after plotting.

    The map is drawn in the axes' current geographic coordinates. Pass
    `extent` (or construct the glyph with `extent=`) so the axes are
    georeferenced — otherwise the coastlines cannot align with the data
    and a warning is emitted. Deriving that extent from a source dataset
    is the caller's job (cleopatra renders supplied coordinates; it does
    not read geotransforms).

    Args:
        style: A name from `available_map_styles()` (`"ecmwf"`,
            `"ecmwf-dark"`), or `"auto"` to pick between them from the
            background luminance (dark backgrounds get the lighter
            `"ecmwf-dark"` greys so coastlines stay visible). Default
            `"ecmwf"`.
        ax: Axes to draw on. Defaults to the glyph's `self.ax`.
        extent: Optional `[xmin, ymin, xmax, ymax]` (i.e.
            `[west, south, east, north]`) in the axes' CRS -- the same
            order as `ArrayGlyph(extent=...)`. When given, the image and
            axis limits are set to it (handling the pixel-coordinate
            RGB/animate case); when omitted the current axis limits are
            used.
        resolution: Natural Earth resolution for the coastline/borders
            (`"110m"`/`"50m"`/`"10m"`). Defaults to the style's value.
        graticule_step: Degree spacing for the graticule. Defaults to a
            "nice" step giving ~6 divisions across the wider span.
        zorder: Draw order for the reference layers (drawn above the
            data; the graticule sits just below the coastlines).

    Returns:
        matplotlib.axes.Axes: The decorated axes, for chaining.

    Raises:
        RuntimeError: If the glyph has no axes yet and `ax` is not given.
        ValueError: If `style` is not a known preset or `"auto"`, or if
            `graticule_step` is given and is not a positive number.

    Examples:
        - Dress a georeferenced field in the ECMWF look:
            ```python
            >>> import numpy as np
            >>> from cleopatra.array_glyph import ArrayGlyph
            >>> data = np.random.rand(20, 30)
            >>> glyph = ArrayGlyph(data, extent=[-100, 15, -40, 55])
            >>> fig, ax = glyph.plot()  # doctest: +SKIP
            >>> glyph.add_reference_map("ecmwf")  # doctest: +SKIP

            ```

    See Also:
        add_features: The Natural Earth layer helper this composes.
        available_map_styles: The built-in preset names.
    """
    if graticule_step is not None and (
        not math.isfinite(graticule_step) or graticule_step <= 0
    ):
        raise ValueError(
            "graticule_step must be a positive, finite number, got "
            f"{graticule_step}"
        )
    target = self._basemap_axes(ax)

    resolved = style
    if style == "auto":
        resolved = "ecmwf-dark" if self._background_is_dark(target) else "ecmwf"
    if resolved not in REFERENCE_MAP_STYLES:
        raise ValueError(
            f"Unknown map style {style!r}; available: "
            f"{available_map_styles()} (or 'auto')."
        )
    preset = REFERENCE_MAP_STYLES[resolved]

    if extent is not None:
        # `[xmin, ymin, xmax, ymax]` == `[west, south, east, north]`,
        # the same order as ArrayGlyph(extent=...); matplotlib wants
        # `(xmin, xmax, ymin, ymax)` for `set_extent`.
        if len(extent) != 4:
            raise ValueError(
                "extent must be [xmin, ymin, xmax, ymax] "
                f"(4 values), got {len(extent)}"
            )
        west, south, east, north = extent
        im = getattr(self, "im", None)
        if im is not None and hasattr(im, "set_extent"):
            im.set_extent((west, east, south, north))
        target.set_xlim(west, east)
        target.set_ylim(south, north)
    elif getattr(self, "extent", None) is None:
        warnings.warn(
            "add_reference_map: the glyph has no geographic extent, so "
            "coastlines/borders may not align with the data. Pass "
            "extent=[west, south, east, north] or construct the glyph "
            "with extent=.",
            stacklevel=2,
        )

    res = resolution or preset["resolution"]
    self.add_features(
        "coastline", res, ax=target, zorder=zorder, **preset["coastline"]
    )
    self.add_features("borders", res, ax=target, zorder=zorder, **preset["borders"])

    xmin, xmax = target.get_xlim()
    ymin, ymax = target.get_ylim()
    step = (
        graticule_step
        if graticule_step is not None
        else _nice_step(max(abs(xmax - xmin), abs(ymax - ymin)))
    )
    target.xaxis.set_major_locator(MultipleLocator(step))
    target.yaxis.set_major_locator(MultipleLocator(step))
    target.xaxis.set_major_formatter(FuncFormatter(_lon_formatter))
    target.yaxis.set_major_formatter(FuncFormatter(_lat_formatter))
    target.grid(True, zorder=zorder - 1, **preset["graticule"])
    target.tick_params(length=0, **preset["labels"])
    for spine in target.spines.values():
        spine.set(**preset["spines"])
    return target
add_relief(*args, ax=None, **kwargs) #

Draw a hypsometric relief backdrop under the glyph's data.

Thin wrapper over cleopatra.reference.add_relief; arguments are forwarded unchanged (e.g. resolution, extent, alpha). Requires the cleopatra[tiles] extra (Pillow).

Parameters:

Name Type Description Default
*args Any

Positional arguments for cleopatra.reference.add_relief (after the axes), such as resolution.

()
ax Any

Axes to draw on. Defaults to the glyph's self.ax.

None
**kwargs Any

Keyword arguments for cleopatra.reference.add_relief.

{}

Returns:

Type Description
Any

matplotlib.axes.Axes: The axes, for chaining.

Raises:

Type Description
RuntimeError

If the glyph has no axes yet and ax is not given.

See Also

cleopatra.reference.add_relief: The underlying implementation and its full parameter list.

Source code in src/cleopatra/geo.py
def add_relief(self, *args: Any, ax: Any = None, **kwargs: Any) -> Any:
    """Draw a hypsometric relief backdrop under the glyph's data.

    Thin wrapper over `cleopatra.reference.add_relief`; arguments are
    forwarded unchanged (e.g. `resolution`, `extent`, `alpha`).
    Requires the `cleopatra[tiles]` extra (Pillow).

    Args:
        *args: Positional arguments for
            `cleopatra.reference.add_relief` (after the axes), such as
            `resolution`.
        ax: Axes to draw on. Defaults to the glyph's `self.ax`.
        **kwargs: Keyword arguments for
            `cleopatra.reference.add_relief`.

    Returns:
        matplotlib.axes.Axes: The axes, for chaining.

    Raises:
        RuntimeError: If the glyph has no axes yet and `ax` is not given.

    See Also:
        cleopatra.reference.add_relief: The underlying implementation and
            its full parameter list.
    """
    return reference.add_relief(self._basemap_axes(ax), *args, **kwargs)
add_tiles(*args, ax=None, **kwargs) #

Overlay a web-tile basemap on the glyph's axes.

Thin wrapper over cleopatra.tiles.add_tiles; positional and keyword arguments are forwarded unchanged (e.g. source, crs, zoom, alpha). When crs is omitted it defaults to self.crs. Requires the cleopatra[tiles] extra.

Parameters:

Name Type Description Default
*args Any

Positional arguments for cleopatra.tiles.add_tiles (after the axes).

()
ax Any

Axes to draw on. Defaults to the glyph's self.ax.

None
**kwargs Any

Keyword arguments for cleopatra.tiles.add_tiles. A crs keyword is defaulted to self.crs when omitted; an explicit crs= overrides it.

{}

Returns:

Type Description
Any

matplotlib.axes.Axes: The axes, for chaining.

Raises:

Type Description
RuntimeError

If the glyph has no axes yet and ax is not given.

See Also

cleopatra.tiles.add_tiles: The underlying implementation and its full parameter list.

Source code in src/cleopatra/geo.py
def add_tiles(self, *args: Any, ax: Any = None, **kwargs: Any) -> Any:
    """Overlay a web-tile basemap on the glyph's axes.

    Thin wrapper over `cleopatra.tiles.add_tiles`; positional and
    keyword arguments are forwarded unchanged (e.g. `source`, `crs`,
    `zoom`, `alpha`). When `crs` is omitted it defaults to `self.crs`.
    Requires the `cleopatra[tiles]` extra.

    Args:
        *args: Positional arguments for `cleopatra.tiles.add_tiles`
            (after the axes).
        ax: Axes to draw on. Defaults to the glyph's `self.ax`.
        **kwargs: Keyword arguments for `cleopatra.tiles.add_tiles`. A
            `crs` keyword is defaulted to `self.crs` when omitted; an
            explicit `crs=` overrides it.

    Returns:
        matplotlib.axes.Axes: The axes, for chaining.

    Raises:
        RuntimeError: If the glyph has no axes yet and `ax` is not given.

    See Also:
        cleopatra.tiles.add_tiles: The underlying implementation and its
            full parameter list.
    """
    return tiles.add_tiles(
        self._basemap_axes(ax), *args, **self._basemap_kwargs(kwargs)
    )

add_point_labels(ax, points, *, color='white', marker_size=5.0, fontsize=9.0, offset=(4.0, 0.0), zorder=6) #

Annotate named points with a plain dot marker + text label.

Draws a small circular marker at each point and a plain text label beside it -- no halo, no bounding box -- matching the minimalist look ECMWF/CAMS maps use for city labels. points are plotted at whatever coordinates ax is already using (plain lon/lat on a flat axes, or projected x/y on an orthographic globe -- reproject the points yourself, e.g. with the same transformer cleopatra.projection.orthographic_grid builds, before calling this on a globe view), so this composes with any projection or colour styling; it makes no assumption about either.

Parameters:

Name Type Description Default
ax Any

Axes to draw on.

required
points dict[str, tuple[float, float]]

Mapping of label text to (x, y) coordinates.

required
color str

Colour for both the marker and the label text.

'white'
marker_size float

Marker size in points.

5.0
fontsize float

Label font size in points.

9.0
offset tuple[float, float]

(dx, dy) label offset from the marker, in points (applied via textcoords="offset points"), so it scales with font size rather than the data coordinates.

(4.0, 0.0)
zorder int

Draw order for both the marker and the label.

6

Returns:

Name Type Description
Axes Any

The same ax, for chaining.

Examples:

  • Label two points and read back the drawn markers/labels:
    >>> import matplotlib.pyplot as plt
    >>> from cleopatra.geo import add_point_labels
    >>> fig, ax = plt.subplots()
    >>> _ = add_point_labels(ax, {"London": (-0.1, 51.5), "Moscow": (37.6, 55.8)})
    >>> len(ax.lines)  # one marker per point
    2
    >>> [t.get_text() for t in ax.texts]
    ['London', 'Moscow']
    >>> plt.close(fig)
    
  • An empty mapping draws nothing but still returns ax, for chaining:
    >>> import matplotlib.pyplot as plt
    >>> from cleopatra.geo import add_point_labels
    >>> fig, ax = plt.subplots()
    >>> add_point_labels(ax, {}) is ax
    True
    >>> plt.close(fig)
    
See Also

GeoMixin.add_labels: The glyph convenience wrapper for this function.

Source code in src/cleopatra/geo.py
def add_point_labels(
    ax: Any,
    points: dict[str, tuple[float, float]],
    *,
    color: str = "white",
    marker_size: float = 5.0,
    fontsize: float = 9.0,
    offset: tuple[float, float] = (4.0, 0.0),
    zorder: int = 6,
) -> Any:
    """Annotate named points with a plain dot marker + text label.

    Draws a small circular marker at each point and a plain text label
    beside it -- no halo, no bounding box -- matching the minimalist look
    ECMWF/CAMS maps use for city labels. `points` are plotted at whatever
    coordinates `ax` is already using (plain lon/lat on a flat axes, or
    projected x/y on an orthographic globe -- reproject the points yourself,
    e.g. with the same transformer `cleopatra.projection.orthographic_grid`
    builds, before calling this on a globe view), so this composes with any
    projection or colour styling; it makes no assumption about either.

    Args:
        ax: Axes to draw on.
        points: Mapping of label text to `(x, y)` coordinates.
        color: Colour for both the marker and the label text.
        marker_size: Marker size in points.
        fontsize: Label font size in points.
        offset: `(dx, dy)` label offset from the marker, in points (applied
            via `textcoords="offset points"`), so it scales with font size
            rather than the data coordinates.
        zorder: Draw order for both the marker and the label.

    Returns:
        Axes: The same `ax`, for chaining.

    Examples:
        - Label two points and read back the drawn markers/labels:
            ```python
            >>> import matplotlib.pyplot as plt
            >>> from cleopatra.geo import add_point_labels
            >>> fig, ax = plt.subplots()
            >>> _ = add_point_labels(ax, {"London": (-0.1, 51.5), "Moscow": (37.6, 55.8)})
            >>> len(ax.lines)  # one marker per point
            2
            >>> [t.get_text() for t in ax.texts]
            ['London', 'Moscow']
            >>> plt.close(fig)

            ```
        - An empty mapping draws nothing but still returns `ax`, for chaining:
            ```python
            >>> import matplotlib.pyplot as plt
            >>> from cleopatra.geo import add_point_labels
            >>> fig, ax = plt.subplots()
            >>> add_point_labels(ax, {}) is ax
            True
            >>> plt.close(fig)

            ```

    See Also:
        GeoMixin.add_labels: The glyph convenience wrapper for this function.
    """
    for label, (x, y) in points.items():
        ax.plot(
            x,
            y,
            marker="o",
            markersize=marker_size,
            color=color,
            linestyle="none",
            zorder=zorder,
        )
        ax.annotate(
            label,
            (x, y),
            xytext=offset,
            textcoords="offset points",
            color=color,
            fontsize=fontsize,
            zorder=zorder,
        )
    return ax

available_map_styles() #

Return the built-in add_reference_map style names.

Returns:

Type Description
list[str]

list[str]: The preset names accepted by

list[str]

GeoMixin.add_reference_map (excluding the special "auto").

Examples:

>>> from cleopatra.geo import available_map_styles
>>> available_map_styles()
['ecmwf', 'ecmwf-dark']
Source code in src/cleopatra/geo.py
def available_map_styles() -> list[str]:
    """Return the built-in `add_reference_map` style names.

    Returns:
        list[str]: The preset names accepted by
        `GeoMixin.add_reference_map` (excluding the special `"auto"`).

    Examples:
        ```python
        >>> from cleopatra.geo import available_map_styles
        >>> available_map_styles()
        ['ecmwf', 'ecmwf-dark']

        ```
    """
    return list(REFERENCE_MAP_STYLES)