HBV Lumped conceptual model#
The Hydrologiska Byrans Vattenbalansavdelning (HBV) model was introduced back in 1972 by the Swedisch Meteological and Hydrological Institute (SMHI). The HBV model is mainly used for runoff simulation and hydrological forecasting.
The model is based on the HBV [Bergström, 1992] model. However, the hydrological routing represent in HBV by a triangular function controlled by the MAXBAS parameter has been removed. Instead, Muskingum routing model is used to route the water downstream, All runoff that is generated in a cell in one of the HBV reservoirs is added to the routed using Muskingum routing method at the end of a timestep. There is no connection between the different HBV cells within the model.
A catchment is divided into a number of grid cells. For each of the cells individually, daily/hourly runoff is computed through application of the lumped HBV. The use of the grid cells offers the possibility to turn the HBV modelling concept, which is originally lumped, into a distributed model.
The HBV model [Bergström, 1992] is usually run with daily time steps, but higher resolution (hourly) can be used if data are available. Input data are precipitation, air temperature and potential evapotranspiration.
HBV model consists of three main components:
-
Soil Moisture
-
Runoff response
-
Lake
-
References
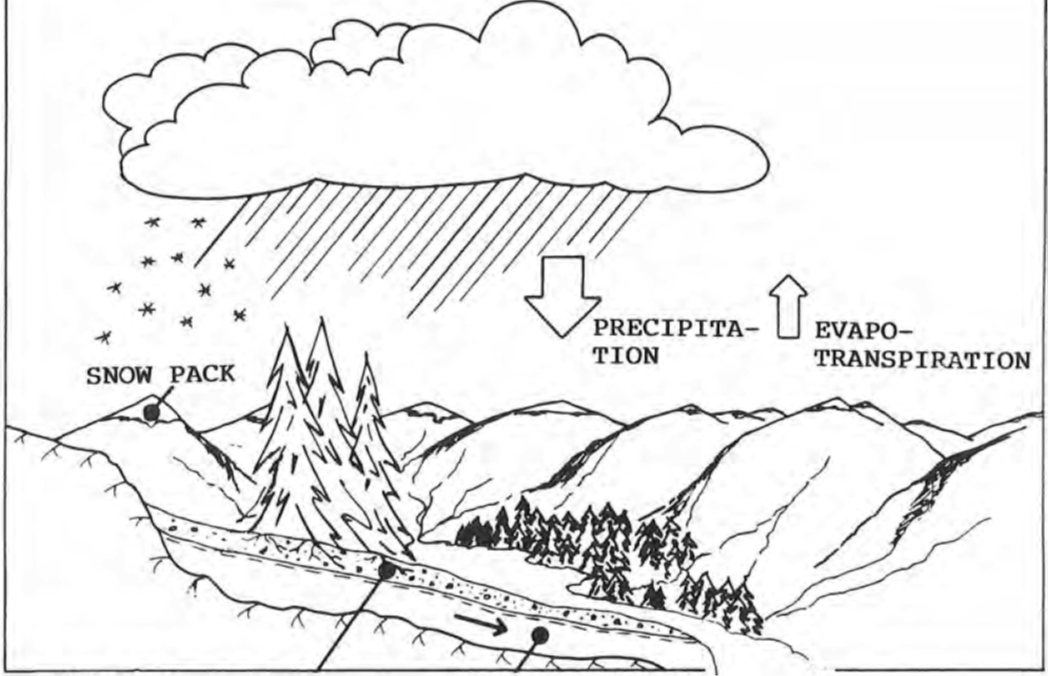 [Bergström, 1992]
snow accumulation and melt, soil moisture accounting, response and river routing subroutines
The soil moisture accounting calculations require data on the potential evapotranspiration. Normally monthly mean standard values are sufficient, but more detailed data can also be used. The source of these data may either be calculations according to the Penman formula or similar, or measurements by evaporimeters. In the latter case it is important to correct for systematic errors before entering the model.
The model has 15 free parameters, values of which are found by calibration, some of the parameters describe the characteristics of the basin while others describe its climate.
the 15 parameter by order are [tt,rfcf,sfcf,cfmax,cwh,cfr,fc,beta,etf,lp,k0,k1,k2,uzl,perc]. Two parameters are added for the correction of the rainfall values rfcf and for the correction of the calculated evapotranspiration values Etf, and in case the catchment does not have a snow then the HBV model used 10 parameter (excluding the first 5 parameters)
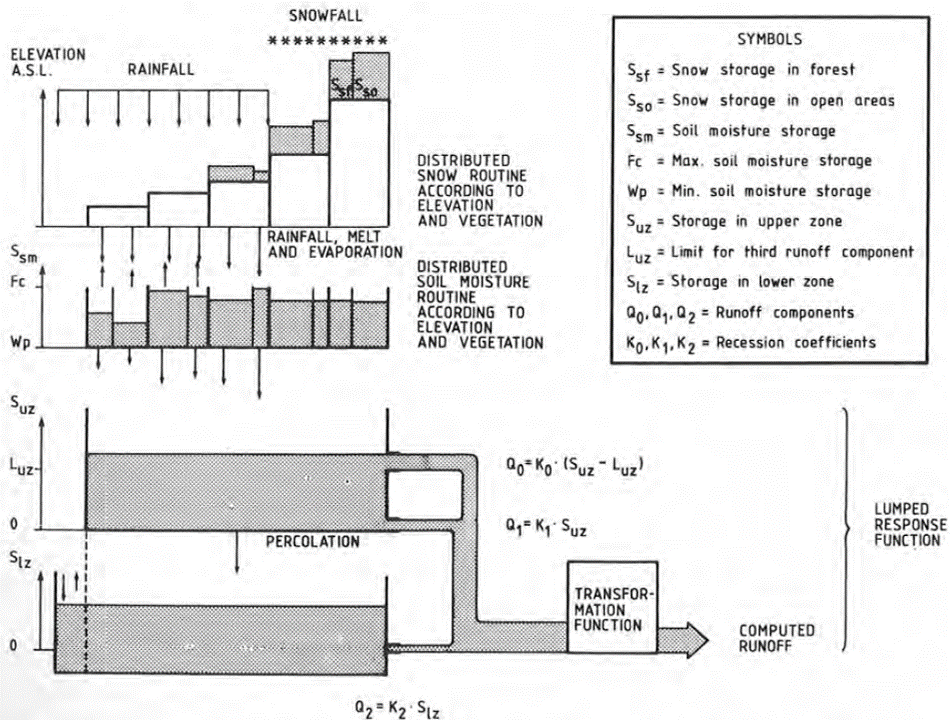
[Bergström, 1992]
Snow#
The snow routine controls snow accumulation and melt. The precipitation accumulates as snow when the air temperature drops below a temperature threshold value (TT). snow accumulation is adjusted by a free parameter, Sfcf, the snowfall correction factor.
If temperature is TT, precipitation occurs as snowfall, and is added to the dry snow component within the snow pack. Otherwise it ends up in the free water reservoir, which represents the liquid water content of the snow pack. Between the two components of the snow pack, interactions take place, either through snow melt (if temperatures are above a threshold TT) or through snow refreezing (if temperatures are below threshold TT).
Melting starts with temperatures above the threshold, TT, according to a simple degree-day
Snow MELT = Cfmax * (T - TT) ; temp > TT Snow Refreezing = Cfr * Cfmax * (TT - T ) ; temp < TT
where: Snow MELT & Snow Refreezing are in (mm/day) Cfmax = degree-day factor (mm/°C · day) TT = temperature threshold (C). The maximum capacity of liquid water the snow can hold (holding water capacity WHC) has to be exceeded before any runoff is generated. A refreezing coefficient, which is used to refreeze free water in the snow if snowmelt is interrupted.
The snow routine of the HBV model has primarily five free parameters that have to be estimated by calibration:
tt,sfcf,cfmax,cwh,cfr.
Soil moisture#
The soil moisture accounting routine computes an index of the wetness of the entire basin and integrates interception and soil moisture storage. Soil moisture subroutine is controlled by three free parameters, FC, BETA and LP. FC (Field capacity) is the maximum soil moisture storage in the basin and BETA (power parameter) determines the relative contribution to runoff from a millimeter of rain or snowmelt at a given soil moisture deficit.
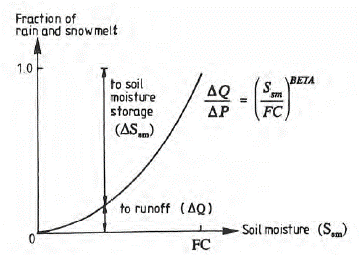
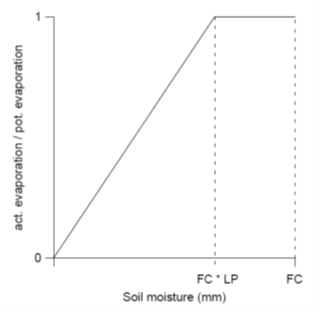
LP controls the shape of the reduction curve for potential evaporation. At soil moisture values below LP the actual evapotranspiration will be reduced.
To accounts for temperature anomalies a correction factor based on mean daily air temperatures and long term averages is used.
Ea = (1 + (T - Tm) * ETF)Ep
where:
Ea is calculated actual evapotranspiration
Ecorr is evapotranspiration correction factor
T is temperature (C)
Tm is monthly long term average temperature (C)
Ep is monthly long term average potential evapotranspiration*
Runoff response#
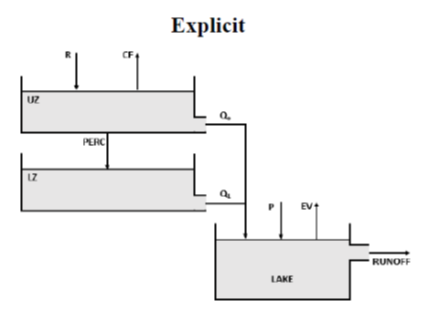
The runoff response routine transforms excess water from the soil moisture routine to discharge. The routine consists of two reservoirs with three free parameters: three recession coefficients, K0, K1 and K2, a threshold UZL, and a constant percolation rate, PERC.
Lake#
lakes can be included explicitly using a storage discharge curve relationship which requires dividing the catchment into sub-basins defined by outlet of lakes. In case of the existence of a lake in the catchment, the outflow from basins upstream of the lake will be summed and be used as an inflow to the lake. Storage in the lake will be computed according to water stage/storage curve or water stage/lake surface area table and outflow can be obtained from a rating curve (IHMS 2010). Lakes have a significant impact on the dynamics of runoff process and the routing and therefore modelled explicitly, and for that the presence of a lake in the catchment is an important factor for choosing substructure based on sub basins. (Lindström et al. 1997)
References#
Bergström, Sten. 1992. “The HBV Model - Its Structure and Applications.” Smhi Rh 4(4): 35.