Skip to content

PolygonGlyph Class#

The PolygonGlyph class wraps matplotlib.collections.PolyCollection. With a per-polygon values array the polygons are filled and colour-mapped through the shared scalar-mapping pipeline and a colorbar is attached. With no values (or outline_only=True) only the polygon outlines are drawn.

The edgecolor option defaults to "none" so a value-filled choropleth renders borderless. Outline mode substitutes cleopatra.glyphs.primitives.polygon_glyph.OUTLINE_EDGECOLOR (black) for that default, since an unfilled polygon with a transparent edge would be invisible; pass an explicit edgecolor to override it.

Class Documentation#

cleopatra.glyphs.primitives.polygon_glyph.PolygonGlyph #

Bases: GeoMixin, Glyph

Visualization class for collections of polygons.

Wraps matplotlib.collections.PolyCollection. With a per-polygon values array, polygons are filled and colour-mapped through the shared scalar-mapping pipeline and a colorbar is attached. With no values (or outline_only=True), only the polygon outlines are drawn, in OUTLINE_EDGECOLOR unless edgecolor is given.

Parameters:

Name Type Description Default
polygons Sequence[ndarray]

Sequence of polygons, each an (n_i, 2) array of (x, y) vertices. Polygons may have differing vertex counts.

required
values ndarray | None

Optional 1D array of per-polygon scalar values for colour mapping. Must match the number of polygons when given. Default is None (outline-only).

None
ax Axes | None

Pre-existing axes to draw on. Default is None.

None
fig Figure | None

Pre-existing figure. Default is None.

None
**kwargs

Override any key in POLYGON_DEFAULT_OPTIONS (e.g. edgecolor, linewidth, cmap, vmin, vmax, levels, color_scale, ticks_spacing, cbar_label, figsize, title). Set add_colorbar=False to suppress the per-glyph colorbar (default True) for shared-axes composition where the host owns a single aggregated colorbar.

{}

Raises:

Type Description
ValueError

If values is given but its length does not match the number of polygons.

Examples:

  • Inspect the value array carried by the collection:
    >>> import numpy as np
    >>> from cleopatra.glyphs.primitives.polygon_glyph import PolygonGlyph
    >>> polys = [
    ...     np.array([[0.0, 0.0], [1.0, 0.0], [0.5, 1.0]]),
    ...     np.array([[1.0, 0.0], [2.0, 0.0], [1.5, 1.0]]),
    ... ]
    >>> glyph = PolygonGlyph(polys, values=np.array([3.0, 7.0]))
    >>> fig, ax, pc = glyph.plot()
    >>> [float(v) for v in pc.get_array()]
    [3.0, 7.0]
    
See Also

cleopatra.glyphs.base.glyph.Glyph._prepare_scalar_mapping: Shared norm/colorbar/ticks pipeline used for the filled path.

Source code in src/cleopatra/glyphs/primitives/polygon_glyph.py
class PolygonGlyph(GeoMixin, Glyph):
    """Visualization class for collections of polygons.

    Wraps `matplotlib.collections.PolyCollection`. With a per-polygon
    `values` array, polygons are filled and colour-mapped through the
    shared scalar-mapping pipeline and a colorbar is attached. With no
    values (or `outline_only=True`), only the polygon outlines are
    drawn, in `OUTLINE_EDGECOLOR` unless `edgecolor` is given.

    Args:
        polygons: Sequence of polygons, each an `(n_i, 2)` array of
            `(x, y)` vertices. Polygons may have differing vertex
            counts.
        values: Optional 1D array of per-polygon scalar values for
            colour mapping. Must match the number of polygons when
            given. Default is None (outline-only).
        ax: Pre-existing axes to draw on. Default is None.
        fig: Pre-existing figure. Default is None.
        **kwargs: Override any key in `POLYGON_DEFAULT_OPTIONS`
            (e.g. `edgecolor`, `linewidth`, `cmap`, `vmin`, `vmax`,
            `levels`, `color_scale`, `ticks_spacing`, `cbar_label`,
            `figsize`, `title`). Set `add_colorbar=False` to suppress the
            per-glyph colorbar (default True) for shared-axes composition
            where the host owns a single aggregated colorbar.

    Raises:
        ValueError: If `values` is given but its length does not match
            the number of polygons.

    Examples:
        - Inspect the value array carried by the collection:
            ```python
            >>> import numpy as np
            >>> from cleopatra.glyphs.primitives.polygon_glyph import PolygonGlyph
            >>> polys = [
            ...     np.array([[0.0, 0.0], [1.0, 0.0], [0.5, 1.0]]),
            ...     np.array([[1.0, 0.0], [2.0, 0.0], [1.5, 1.0]]),
            ... ]
            >>> glyph = PolygonGlyph(polys, values=np.array([3.0, 7.0]))
            >>> fig, ax, pc = glyph.plot()
            >>> [float(v) for v in pc.get_array()]
            [3.0, 7.0]

            ```

    See Also:
        cleopatra.glyphs.base.glyph.Glyph._prepare_scalar_mapping: Shared
            norm/colorbar/ticks pipeline used for the filled path.
    """

    #: Option keys this glyph accepts (see `Glyph.option_keys`/`filter_kwargs`).
    DEFAULT_OPTIONS = POLYGON_DEFAULT_OPTIONS
    #: Per-polygon `values` are a nominal class label just as often as a
    #: continuous magnitude, so `scheme="categorical"` is supported.
    _SUPPORTS_CATEGORICAL_SCHEME = True

    def __init__(
        self,
        polygons: Sequence[np.ndarray],
        values: np.ndarray | None = None,
        *,
        ax: Axes | None = None,
        fig: Figure | None = None,
        **kwargs,
    ):
        super().__init__(
            default_options=POLYGON_DEFAULT_OPTIONS, fig=fig, ax=ax, **kwargs
        )
        self.polygons = [np.asarray(p, dtype=float) for p in polygons]
        if values is not None:
            values = np.asarray(values)
            if values.shape != (len(self.polygons),):
                raise ValueError(
                    f"values shape {values.shape} must match the number of "
                    f"polygons ({len(self.polygons)},)."
                )
        self.values = values
        self.cbar: Colorbar | None = None
        #: The disjoint legend created by `plot` when `scheme="categorical"`
        #: (`None` otherwise); built via `Glyph.create_categorical_legend`.
        self.category_legend: Legend | None = None

    def plot(
        self,
        outline_only: bool = False,
        ax: Axes | None = None,
        title: str | None = None,
        add_colorbar: bool | None = None,
        colorbar: bool | ColorBar | None = None,
        color: ColorScaling | None = None,
        contour: Contour | None = None,
        classify: Classify | None = None,
    ) -> tuple[Figure, Axes, PolyCollection]:
        """Draw the polygons, filling by value when present.

        When `values` was supplied and `outline_only` is False, the
        polygons are filled and colour-mapped through
        `_prepare_scalar_mapping` (so `vmin` / `vmax` / `levels` /
        `color_scale` apply) with a matching colorbar. Otherwise only
        the outlines are drawn and no colorbar is added; the outlines
        use `OUTLINE_EDGECOLOR` when `edgecolor` is left at its
        borderless-fill default of `"none"`.

        The one exception is `scheme="categorical"`: `vmin` / `vmax` /
        `levels` / `color_scale` are ignored (with a warning if set), and
        instead of a colorbar a `disjoint_legend` is drawn and stored on
        `self.category_legend` (`self.cbar` stays `None`). See
        `Glyph._prepare_categorical_mapping`.

        Args:
            outline_only: Draw unfilled outlines even when `values` is
                present (the `shapes` use case). Default is False.
            ax: Axes to draw on. Falls back to the axes supplied at
                construction, otherwise a new figure/axes is created.
            title: Plot title. Overrides `default_options["title"]`
                when given.
            add_colorbar: Override the `add_colorbar` option for this call
                — True draws the colorbar, False suppresses it (for
                shared-axes composition). Defaults to None, which keeps the
                value set at construction.
            colorbar: Typed `ColorBar` spec (or `True`/`False`/`None`) for the
                colorbar's placement, caption, and sizing; resolved into the
                `cbar_*` options. A `ColorBar`/`True` also enables the bar and is
                **sticky** -- it persists into later plots, overriding a
                construction-time `add_colorbar=False`; an explicit
                `add_colorbar=` argument still wins the on/off decision.

        Returns:
            tuple[Figure, Axes, PolyCollection]: The figure, the axes,
                and the `PolyCollection` added to the axes.

        Examples:
            - Outline-only mode carries no colour array and no colorbar,
                and its edges are opaque so the outlines are visible:
                ```python
                >>> import numpy as np
                >>> from cleopatra.glyphs.primitives.polygon_glyph import PolygonGlyph
                >>> polys = [np.array([[0.0, 0.0], [1.0, 0.0], [0.5, 1.0]])]
                >>> glyph = PolygonGlyph(polys, values=np.array([5.0]))
                >>> fig, ax, pc = glyph.plot(outline_only=True)
                >>> pc.get_array() is None
                True
                >>> glyph.cbar is None
                True
                >>> float(pc.get_edgecolor()[0][3])  # alpha
                1.0

                ```
            - An explicit `edgecolor` is honoured as given:
                ```python
                >>> glyph = PolygonGlyph(polys, edgecolor="navy")
                >>> fig, ax, pc = glyph.plot(outline_only=True)
                >>> tuple(round(float(c), 3) for c in pc.get_edgecolor()[0])
                (0.0, 0.0, 0.502, 1.0)

                ```
        """
        with self._rollback_options_on_error():
            self._merge_group_params(color, contour, classify)

            if ax is not None:
                self.ax = ax
                self.fig = _root_figure(ax)
            elif self.ax is None:
                self.fig, self.ax = self.create_figure_axes()
            ax = self.ax
            assert self.fig is not None
            opts = self.default_options

            if title is not None:
                opts["title"] = title
            opts.update(_resolve_colorbar(colorbar))
            draw_colorbar = opts["add_colorbar"] if add_colorbar is None else add_colorbar
            self.cbar = None
            self.category_legend = None

            if outline_only or self.values is None:
                edgecolor = opts["edgecolor"]
                if isinstance(edgecolor, str) and edgecolor.lower() == "none":
                    edgecolor = OUTLINE_EDGECOLOR
                pc = PolyCollection(
                    self.polygons,
                    facecolors="none",
                    edgecolors=edgecolor,
                    linewidths=opts["linewidth"],
                )
                ax.add_collection(pc)
                ax.autoscale_view()
            else:
                norm, cbar_kw, ticks = self._prepare_scalar_mapping(self.values)
                categorical = self._categorical
                if categorical is not None:
                    color_array, cmap = categorical["codes"], categorical["cmap"]
                else:
                    color_array, cmap = np.asarray(self.values), resolve_colormap(opts["cmap"])
                pc = PolyCollection(
                    self.polygons,
                    array=color_array,
                    cmap=cmap,
                    norm=norm,
                    edgecolors=opts["edgecolor"],
                    linewidths=opts["linewidth"],
                )
                if norm is None:
                    pc.set_clim(ticks[0], ticks[-1])
                ax.add_collection(pc)
                ax.autoscale_view()
                if draw_colorbar:
                    if categorical is not None:
                        self.category_legend = self.create_categorical_legend(ax)
                    else:
                        self.cbar = self.create_color_bar(ax, pc, cbar_kw)

            if opts["title"]:
                ax.set_title(opts["title"], fontsize=opts["title_size"])

            return self.fig, ax, pc

plot(outline_only=False, ax=None, title=None, add_colorbar=None, colorbar=None, color=None, contour=None, classify=None) #

Draw the polygons, filling by value when present.

When values was supplied and outline_only is False, the polygons are filled and colour-mapped through _prepare_scalar_mapping (so vmin / vmax / levels / color_scale apply) with a matching colorbar. Otherwise only the outlines are drawn and no colorbar is added; the outlines use OUTLINE_EDGECOLOR when edgecolor is left at its borderless-fill default of "none".

The one exception is scheme="categorical": vmin / vmax / levels / color_scale are ignored (with a warning if set), and instead of a colorbar a disjoint_legend is drawn and stored on self.category_legend (self.cbar stays None). See Glyph._prepare_categorical_mapping.

Parameters:

Name Type Description Default
outline_only bool

Draw unfilled outlines even when values is present (the shapes use case). Default is False.

False
ax Axes | None

Axes to draw on. Falls back to the axes supplied at construction, otherwise a new figure/axes is created.

None
title str | None

Plot title. Overrides default_options["title"] when given.

None
add_colorbar bool | None

Override the add_colorbar option for this call — True draws the colorbar, False suppresses it (for shared-axes composition). Defaults to None, which keeps the value set at construction.

None
colorbar bool | ColorBar | None

Typed ColorBar spec (or True/False/None) for the colorbar's placement, caption, and sizing; resolved into the cbar_* options. A ColorBar/True also enables the bar and is sticky -- it persists into later plots, overriding a construction-time add_colorbar=False; an explicit add_colorbar= argument still wins the on/off decision.

None

Returns:

Type Description
tuple[Figure, Axes, PolyCollection]

tuple[Figure, Axes, PolyCollection]: The figure, the axes, and the PolyCollection added to the axes.

Examples:

  • Outline-only mode carries no colour array and no colorbar, and its edges are opaque so the outlines are visible:
    >>> import numpy as np
    >>> from cleopatra.glyphs.primitives.polygon_glyph import PolygonGlyph
    >>> polys = [np.array([[0.0, 0.0], [1.0, 0.0], [0.5, 1.0]])]
    >>> glyph = PolygonGlyph(polys, values=np.array([5.0]))
    >>> fig, ax, pc = glyph.plot(outline_only=True)
    >>> pc.get_array() is None
    True
    >>> glyph.cbar is None
    True
    >>> float(pc.get_edgecolor()[0][3])  # alpha
    1.0
    
  • An explicit edgecolor is honoured as given:
    >>> glyph = PolygonGlyph(polys, edgecolor="navy")
    >>> fig, ax, pc = glyph.plot(outline_only=True)
    >>> tuple(round(float(c), 3) for c in pc.get_edgecolor()[0])
    (0.0, 0.0, 0.502, 1.0)
    
Source code in src/cleopatra/glyphs/primitives/polygon_glyph.py
def plot(
    self,
    outline_only: bool = False,
    ax: Axes | None = None,
    title: str | None = None,
    add_colorbar: bool | None = None,
    colorbar: bool | ColorBar | None = None,
    color: ColorScaling | None = None,
    contour: Contour | None = None,
    classify: Classify | None = None,
) -> tuple[Figure, Axes, PolyCollection]:
    """Draw the polygons, filling by value when present.

    When `values` was supplied and `outline_only` is False, the
    polygons are filled and colour-mapped through
    `_prepare_scalar_mapping` (so `vmin` / `vmax` / `levels` /
    `color_scale` apply) with a matching colorbar. Otherwise only
    the outlines are drawn and no colorbar is added; the outlines
    use `OUTLINE_EDGECOLOR` when `edgecolor` is left at its
    borderless-fill default of `"none"`.

    The one exception is `scheme="categorical"`: `vmin` / `vmax` /
    `levels` / `color_scale` are ignored (with a warning if set), and
    instead of a colorbar a `disjoint_legend` is drawn and stored on
    `self.category_legend` (`self.cbar` stays `None`). See
    `Glyph._prepare_categorical_mapping`.

    Args:
        outline_only: Draw unfilled outlines even when `values` is
            present (the `shapes` use case). Default is False.
        ax: Axes to draw on. Falls back to the axes supplied at
            construction, otherwise a new figure/axes is created.
        title: Plot title. Overrides `default_options["title"]`
            when given.
        add_colorbar: Override the `add_colorbar` option for this call
            — True draws the colorbar, False suppresses it (for
            shared-axes composition). Defaults to None, which keeps the
            value set at construction.
        colorbar: Typed `ColorBar` spec (or `True`/`False`/`None`) for the
            colorbar's placement, caption, and sizing; resolved into the
            `cbar_*` options. A `ColorBar`/`True` also enables the bar and is
            **sticky** -- it persists into later plots, overriding a
            construction-time `add_colorbar=False`; an explicit
            `add_colorbar=` argument still wins the on/off decision.

    Returns:
        tuple[Figure, Axes, PolyCollection]: The figure, the axes,
            and the `PolyCollection` added to the axes.

    Examples:
        - Outline-only mode carries no colour array and no colorbar,
            and its edges are opaque so the outlines are visible:
            ```python
            >>> import numpy as np
            >>> from cleopatra.glyphs.primitives.polygon_glyph import PolygonGlyph
            >>> polys = [np.array([[0.0, 0.0], [1.0, 0.0], [0.5, 1.0]])]
            >>> glyph = PolygonGlyph(polys, values=np.array([5.0]))
            >>> fig, ax, pc = glyph.plot(outline_only=True)
            >>> pc.get_array() is None
            True
            >>> glyph.cbar is None
            True
            >>> float(pc.get_edgecolor()[0][3])  # alpha
            1.0

            ```
        - An explicit `edgecolor` is honoured as given:
            ```python
            >>> glyph = PolygonGlyph(polys, edgecolor="navy")
            >>> fig, ax, pc = glyph.plot(outline_only=True)
            >>> tuple(round(float(c), 3) for c in pc.get_edgecolor()[0])
            (0.0, 0.0, 0.502, 1.0)

            ```
    """
    with self._rollback_options_on_error():
        self._merge_group_params(color, contour, classify)

        if ax is not None:
            self.ax = ax
            self.fig = _root_figure(ax)
        elif self.ax is None:
            self.fig, self.ax = self.create_figure_axes()
        ax = self.ax
        assert self.fig is not None
        opts = self.default_options

        if title is not None:
            opts["title"] = title
        opts.update(_resolve_colorbar(colorbar))
        draw_colorbar = opts["add_colorbar"] if add_colorbar is None else add_colorbar
        self.cbar = None
        self.category_legend = None

        if outline_only or self.values is None:
            edgecolor = opts["edgecolor"]
            if isinstance(edgecolor, str) and edgecolor.lower() == "none":
                edgecolor = OUTLINE_EDGECOLOR
            pc = PolyCollection(
                self.polygons,
                facecolors="none",
                edgecolors=edgecolor,
                linewidths=opts["linewidth"],
            )
            ax.add_collection(pc)
            ax.autoscale_view()
        else:
            norm, cbar_kw, ticks = self._prepare_scalar_mapping(self.values)
            categorical = self._categorical
            if categorical is not None:
                color_array, cmap = categorical["codes"], categorical["cmap"]
            else:
                color_array, cmap = np.asarray(self.values), resolve_colormap(opts["cmap"])
            pc = PolyCollection(
                self.polygons,
                array=color_array,
                cmap=cmap,
                norm=norm,
                edgecolors=opts["edgecolor"],
                linewidths=opts["linewidth"],
            )
            if norm is None:
                pc.set_clim(ticks[0], ticks[-1])
            ax.add_collection(pc)
            ax.autoscale_view()
            if draw_colorbar:
                if categorical is not None:
                    self.category_legend = self.create_categorical_legend(ax)
                else:
                    self.cbar = self.create_color_bar(ax, pc, cbar_kw)

        if opts["title"]:
            ax.set_title(opts["title"], fontsize=opts["title_size"])

        return self.fig, ax, pc

Examples#

Value-filled polygons#

import numpy as np
from cleopatra.glyphs.primitives.polygon_glyph import PolygonGlyph

polygons = [
    np.array([[0.0, 0.0], [1.0, 0.0], [1.0, 1.0], [0.0, 1.0]]),
    np.array([[1.0, 0.0], [2.0, 0.0], [2.0, 1.0], [1.0, 1.0]]),
    np.array([[0.0, 1.0], [1.0, 1.0], [0.5, 2.0]]),
]
values = np.array([10.0, 20.0, 30.0])

pg = PolygonGlyph(polygons, values=values)
fig, ax, pc = pg.plot(title="Polygons by value")
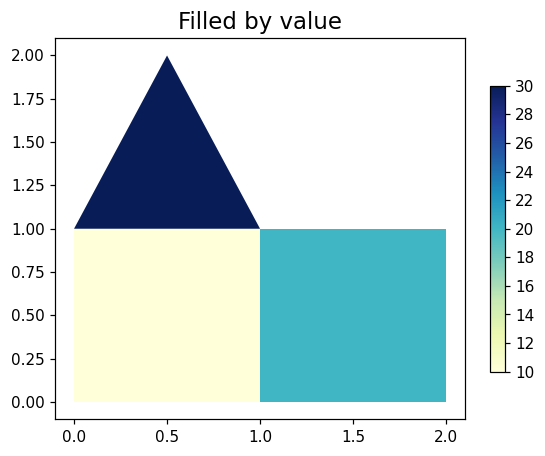
Polygons filled by value

Outlines only#

pg = PolygonGlyph(polygons)
fig, ax, pc = pg.plot(outline_only=True)

# ... or pick the outline colour and width
pg = PolygonGlyph(polygons, edgecolor="navy", linewidth=1.5)
fig, ax, pc = pg.plot(outline_only=True)
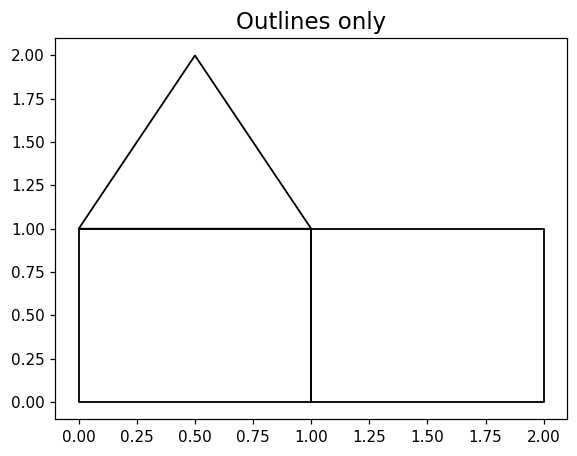
Polygon outlines