Skip to content

ArrayGlyph Class#

The ArrayGlyph class visualizes 2-D and 3-D numpy arrays: static plots with colorbars, cell-value labels and point overlays, faceted grids of subplots, and animations exported to GIF / MP4 / MOV / AVI.

Class Documentation#

cleopatra.glyphs.gridded.array_glyph.ArrayGlyph #

Bases: GeoMixin, Glyph

A class to handle arrays and perform various visualization operations on them.

The ArrayGlyph class provides functionality for visualizing 2D and 3D arrays with various customization options. It supports plotting single arrays, RGB arrays, and creating animations from 3D arrays.

Attributes:

Name Type Description
fig Figure

The matplotlib figure object.

ax Axes

The matplotlib axes object.

extent List

The extent of the array [xmin, xmax, ymin, ymax].

rgb bool

Whether the array is an RGB array.

num_domain_cells int

Number of cells in the data domain — cells that are neither masked (via exclude_value) nor NaN. A stack (3-D (n, h, w) grey or 4-D (n, h, w, 3)) is counted on its first frame; a single frame (2-D, or an (h, w, 3) RGB image from rgb_bands) is counted whole. For a single-band frame it equals the number of per-cell value labels drawn when display_cell_value=True; for multi-channel RGB data it counts elements and is informational (RGB renders draw no per-cell labels).

anim FuncAnimation

The animation object if created.

im ScalarMappable

The colour-mapped artist produced by the most recent plot/animate call (e.g. the AxesImage for imshow, the QuadMesh for pcolormesh, the QuadContourSet for contour/contourf, or the RGB AxesImage). None before the first render. Lets a caller attach a colorbar/legend or query the colour limits without scraping ax.images/ax.collections.

cbar Colorbar

The colorbar drawn by the glyph, or None when none was drawn (RGB, or add_colorbar=False).

contour_labels list

The inline contour-label Text artists from the most recent plot(kind="contour", labels=True), or None when labelling was not requested (the default, and for every kind other than "contour"). A labelled contour with no isolines (e.g. a constant-value field) yields an empty list.

Notes

This class provides methods for: - Plotting arrays with customizable color scales, color bars, and annotations - Creating animations from 3D arrays - Displaying point values on arrays - Customizing plot appearance

Examples:

  • Create a simple array plot:
    >>> import numpy as np
    >>> from cleopatra.glyphs.gridded.array_glyph import ArrayGlyph
    >>> arr = np.array([[1, 2, 3], [4, 5, 6], [7, 8, 9]])
    >>> array_glyph = ArrayGlyph(arr)
    >>> fig, ax = array_glyph.plot()
    
  • Create an RGB plot from a 3D array:
    >>> from cleopatra.glyphs.gridded.array_glyph import RgbBands
    >>> rgb_array = np.random.randint(0, 255, size=(3, 10, 10))
    >>> rgb_glyph = ArrayGlyph(rgb_array, rgb_bands=RgbBands([0, 1, 2]))
    >>> fig, ax = rgb_glyph.plot()
    
  • Create an animated plot from a 3D array:
    >>> time_series = np.random.randint(1, 10, size=(5, 10, 10))
    >>> time_labels = ["Frame 1", "Frame 2", "Frame 3", "Frame 4", "Frame 5"]
    >>> animated_glyph = ArrayGlyph(time_series)
    >>> anim = animated_glyph.animate(time_labels)
    
Source code in src/cleopatra/glyphs/gridded/array_glyph.py
1199
1200
1201
1202
1203
1204
1205
1206
1207
1208
1209
1210
1211
1212
1213
1214
1215
1216
1217
1218
1219
1220
1221
1222
1223
1224
1225
1226
1227
1228
1229
1230
1231
1232
1233
1234
1235
1236
1237
1238
1239
1240
1241
1242
1243
1244
1245
1246
1247
1248
1249
1250
1251
1252
1253
1254
1255
1256
1257
1258
1259
1260
1261
1262
1263
1264
1265
1266
1267
1268
1269
1270
1271
1272
1273
1274
1275
1276
1277
1278
1279
1280
1281
1282
1283
1284
1285
1286
1287
1288
1289
1290
1291
1292
1293
1294
1295
1296
1297
1298
1299
1300
1301
1302
1303
1304
1305
1306
1307
1308
1309
1310
1311
1312
1313
1314
1315
1316
1317
1318
1319
1320
1321
1322
1323
1324
1325
1326
1327
1328
1329
1330
1331
1332
1333
1334
1335
1336
1337
1338
1339
1340
1341
1342
1343
1344
1345
1346
1347
1348
1349
1350
1351
1352
1353
1354
1355
1356
1357
1358
1359
1360
1361
1362
1363
1364
1365
1366
1367
1368
1369
1370
1371
1372
1373
1374
1375
1376
1377
1378
1379
1380
1381
1382
1383
1384
1385
1386
1387
1388
1389
1390
1391
1392
1393
1394
1395
1396
1397
1398
1399
1400
1401
1402
1403
1404
1405
1406
1407
1408
1409
1410
1411
1412
1413
1414
1415
1416
1417
1418
1419
1420
1421
1422
1423
1424
1425
1426
1427
1428
1429
1430
1431
1432
1433
1434
1435
1436
1437
1438
1439
1440
1441
1442
1443
1444
1445
1446
1447
1448
1449
1450
1451
1452
1453
1454
1455
1456
1457
1458
1459
1460
1461
1462
1463
1464
1465
1466
1467
1468
1469
1470
1471
1472
1473
1474
1475
1476
1477
1478
1479
1480
1481
1482
1483
1484
1485
1486
1487
1488
1489
1490
1491
1492
1493
1494
1495
1496
1497
1498
1499
1500
1501
1502
1503
1504
1505
1506
1507
1508
1509
1510
1511
1512
1513
1514
1515
1516
1517
1518
1519
1520
1521
1522
1523
1524
1525
1526
1527
1528
1529
1530
1531
1532
1533
1534
1535
1536
1537
1538
1539
1540
1541
1542
1543
1544
1545
1546
1547
1548
1549
1550
1551
1552
1553
1554
1555
1556
1557
1558
1559
1560
1561
1562
1563
1564
1565
1566
1567
1568
1569
1570
1571
1572
1573
1574
1575
1576
1577
1578
1579
1580
1581
1582
1583
1584
1585
1586
1587
1588
1589
1590
1591
1592
1593
1594
1595
1596
1597
1598
1599
1600
1601
1602
1603
1604
1605
1606
1607
1608
1609
1610
1611
1612
1613
1614
1615
1616
1617
1618
1619
1620
1621
1622
1623
1624
1625
1626
1627
1628
1629
1630
1631
1632
1633
1634
1635
1636
1637
1638
1639
1640
1641
1642
1643
1644
1645
1646
1647
1648
1649
1650
1651
1652
1653
1654
1655
1656
1657
1658
1659
1660
1661
1662
1663
1664
1665
1666
1667
1668
1669
1670
1671
1672
1673
1674
1675
1676
1677
1678
1679
1680
1681
1682
1683
1684
1685
1686
1687
1688
1689
1690
1691
1692
1693
1694
1695
1696
1697
1698
1699
1700
1701
1702
1703
1704
1705
1706
1707
1708
1709
1710
1711
1712
1713
1714
1715
1716
1717
1718
1719
1720
1721
1722
1723
1724
1725
1726
1727
1728
1729
1730
1731
1732
1733
1734
1735
1736
1737
1738
1739
1740
1741
1742
1743
1744
1745
1746
1747
1748
1749
1750
1751
1752
1753
1754
1755
1756
1757
1758
1759
1760
1761
1762
1763
1764
1765
1766
1767
1768
1769
1770
1771
1772
1773
1774
1775
1776
1777
1778
1779
1780
1781
1782
1783
1784
1785
1786
1787
1788
1789
1790
1791
1792
1793
1794
1795
1796
1797
1798
1799
1800
1801
1802
1803
1804
1805
1806
1807
1808
1809
1810
1811
1812
1813
1814
1815
1816
1817
1818
1819
1820
1821
1822
1823
1824
1825
1826
1827
1828
1829
1830
1831
1832
1833
1834
1835
1836
1837
1838
1839
1840
1841
1842
1843
1844
1845
1846
1847
1848
1849
1850
1851
1852
1853
1854
1855
1856
1857
1858
1859
1860
1861
1862
1863
1864
1865
1866
1867
1868
1869
1870
1871
1872
1873
1874
1875
1876
1877
1878
1879
1880
1881
1882
1883
1884
1885
1886
1887
1888
1889
1890
1891
1892
1893
1894
1895
1896
1897
1898
1899
1900
1901
1902
1903
1904
1905
1906
1907
1908
1909
1910
1911
1912
1913
1914
1915
1916
1917
1918
1919
1920
1921
1922
1923
1924
1925
1926
1927
1928
1929
1930
1931
1932
1933
1934
1935
1936
1937
1938
1939
1940
1941
1942
1943
1944
1945
1946
1947
1948
1949
1950
1951
1952
1953
1954
1955
1956
1957
1958
1959
1960
1961
1962
1963
1964
1965
1966
1967
1968
1969
1970
1971
1972
1973
1974
1975
1976
1977
1978
1979
1980
1981
1982
1983
1984
1985
1986
1987
1988
1989
1990
1991
1992
1993
1994
1995
1996
1997
1998
1999
2000
2001
2002
2003
2004
2005
2006
2007
2008
2009
2010
2011
2012
2013
2014
2015
2016
2017
2018
2019
2020
2021
2022
2023
2024
2025
2026
2027
2028
2029
2030
2031
2032
2033
2034
2035
2036
2037
2038
2039
2040
2041
2042
2043
2044
2045
2046
2047
2048
2049
2050
2051
2052
2053
2054
2055
2056
2057
2058
2059
2060
2061
2062
2063
2064
2065
2066
2067
2068
2069
2070
2071
2072
2073
2074
2075
2076
2077
2078
2079
2080
2081
2082
2083
2084
2085
2086
2087
2088
2089
2090
2091
2092
2093
2094
2095
2096
2097
2098
2099
2100
2101
2102
2103
2104
2105
2106
2107
2108
2109
2110
2111
2112
2113
2114
2115
2116
2117
2118
2119
2120
2121
2122
2123
2124
2125
2126
2127
2128
2129
2130
2131
2132
2133
2134
2135
2136
2137
2138
2139
2140
2141
2142
2143
2144
2145
2146
2147
2148
2149
2150
2151
2152
2153
2154
2155
2156
2157
2158
2159
2160
2161
2162
2163
2164
2165
2166
2167
2168
2169
2170
2171
2172
2173
2174
2175
2176
2177
2178
2179
2180
2181
2182
2183
2184
2185
2186
2187
2188
2189
2190
2191
2192
2193
2194
2195
2196
2197
2198
2199
2200
2201
2202
2203
2204
2205
2206
2207
2208
2209
2210
2211
2212
2213
2214
2215
2216
2217
2218
2219
2220
2221
2222
2223
2224
2225
2226
2227
2228
2229
2230
2231
2232
2233
2234
2235
2236
2237
2238
2239
2240
2241
2242
2243
2244
2245
2246
2247
2248
2249
2250
2251
2252
2253
2254
2255
2256
2257
2258
2259
2260
2261
2262
2263
2264
2265
2266
2267
2268
2269
2270
2271
2272
2273
2274
2275
2276
2277
2278
2279
2280
2281
2282
2283
2284
2285
2286
2287
2288
2289
2290
2291
2292
2293
2294
2295
2296
2297
2298
2299
2300
2301
2302
2303
2304
2305
2306
2307
2308
2309
2310
2311
2312
2313
2314
2315
2316
2317
2318
2319
2320
2321
2322
2323
2324
2325
2326
2327
2328
2329
2330
2331
2332
2333
2334
2335
2336
2337
2338
2339
2340
2341
2342
2343
2344
2345
2346
2347
2348
2349
2350
2351
2352
2353
2354
2355
2356
2357
2358
2359
2360
2361
2362
2363
2364
2365
2366
2367
2368
2369
2370
2371
2372
2373
2374
2375
2376
2377
2378
2379
2380
2381
2382
2383
2384
2385
2386
2387
2388
2389
2390
2391
2392
2393
2394
2395
2396
2397
2398
2399
2400
2401
2402
2403
2404
2405
2406
2407
2408
2409
2410
2411
2412
2413
2414
2415
2416
2417
2418
2419
2420
2421
2422
2423
2424
2425
2426
2427
2428
2429
2430
2431
2432
2433
2434
2435
2436
2437
2438
2439
2440
2441
2442
2443
2444
2445
2446
2447
2448
2449
2450
2451
2452
2453
2454
2455
2456
2457
2458
2459
2460
2461
2462
2463
2464
2465
2466
2467
2468
2469
2470
2471
2472
2473
2474
2475
2476
2477
2478
2479
2480
2481
2482
2483
2484
2485
2486
2487
2488
2489
2490
2491
2492
2493
2494
2495
2496
2497
2498
2499
2500
2501
2502
2503
2504
2505
2506
2507
2508
2509
2510
2511
2512
2513
2514
2515
2516
2517
2518
2519
2520
2521
2522
2523
2524
2525
2526
2527
2528
2529
2530
2531
2532
2533
2534
2535
2536
2537
2538
2539
2540
2541
2542
2543
2544
2545
2546
2547
2548
2549
2550
2551
2552
2553
2554
2555
2556
2557
2558
2559
2560
2561
2562
2563
2564
2565
2566
2567
2568
2569
2570
2571
2572
2573
2574
2575
2576
2577
2578
2579
2580
2581
2582
2583
2584
2585
2586
2587
2588
2589
2590
2591
2592
2593
2594
2595
2596
2597
2598
2599
2600
2601
2602
2603
2604
2605
2606
2607
2608
2609
2610
2611
2612
2613
2614
2615
2616
2617
2618
2619
2620
2621
2622
2623
2624
2625
2626
2627
2628
2629
2630
2631
2632
2633
2634
2635
2636
2637
2638
2639
2640
2641
2642
2643
2644
2645
2646
2647
2648
2649
2650
2651
2652
2653
2654
2655
2656
2657
2658
2659
2660
2661
2662
2663
2664
2665
2666
2667
2668
2669
2670
2671
2672
2673
2674
2675
2676
2677
2678
2679
2680
2681
2682
2683
2684
2685
2686
2687
2688
2689
2690
2691
2692
2693
2694
2695
2696
2697
2698
2699
2700
2701
2702
2703
2704
2705
2706
2707
2708
2709
2710
2711
2712
2713
2714
2715
2716
2717
2718
2719
2720
2721
2722
2723
2724
2725
2726
2727
2728
2729
2730
2731
2732
2733
2734
2735
2736
2737
2738
2739
2740
2741
2742
2743
2744
2745
2746
2747
2748
2749
2750
2751
2752
2753
2754
2755
2756
2757
2758
2759
2760
2761
2762
2763
2764
2765
2766
2767
2768
2769
2770
2771
2772
2773
2774
2775
2776
2777
2778
2779
2780
2781
2782
2783
2784
2785
2786
2787
2788
2789
2790
2791
2792
2793
2794
2795
2796
2797
2798
2799
2800
2801
2802
2803
2804
2805
2806
2807
2808
2809
2810
2811
2812
2813
2814
2815
2816
2817
2818
2819
2820
2821
2822
2823
2824
2825
2826
2827
2828
2829
2830
2831
2832
2833
2834
2835
2836
2837
2838
2839
2840
2841
2842
2843
2844
2845
2846
2847
2848
2849
2850
2851
2852
2853
2854
2855
2856
2857
2858
2859
2860
2861
2862
2863
2864
2865
2866
2867
2868
2869
2870
2871
2872
2873
2874
2875
2876
2877
2878
2879
2880
2881
2882
2883
2884
2885
2886
2887
2888
2889
2890
2891
2892
2893
2894
2895
2896
2897
2898
2899
2900
2901
2902
2903
2904
2905
2906
2907
2908
2909
2910
2911
2912
2913
2914
2915
2916
2917
2918
2919
2920
2921
2922
2923
2924
2925
2926
2927
2928
2929
2930
2931
2932
2933
2934
2935
2936
2937
2938
2939
2940
2941
2942
2943
2944
2945
2946
2947
2948
2949
2950
2951
2952
2953
2954
2955
2956
2957
2958
2959
2960
2961
2962
2963
2964
2965
2966
2967
2968
2969
2970
2971
2972
2973
2974
2975
2976
2977
2978
2979
2980
2981
2982
2983
2984
2985
2986
2987
2988
2989
2990
2991
2992
2993
2994
2995
2996
2997
2998
2999
3000
3001
3002
3003
3004
3005
3006
3007
3008
3009
3010
3011
3012
3013
3014
3015
3016
3017
3018
3019
3020
3021
3022
3023
3024
3025
3026
3027
3028
3029
3030
3031
3032
3033
3034
3035
3036
3037
3038
3039
3040
3041
3042
3043
3044
3045
3046
3047
3048
3049
3050
3051
3052
3053
3054
3055
3056
3057
3058
3059
3060
3061
3062
3063
3064
3065
3066
3067
3068
3069
3070
3071
3072
3073
3074
3075
3076
3077
3078
3079
3080
3081
3082
3083
3084
3085
3086
3087
3088
3089
3090
3091
3092
3093
3094
3095
3096
3097
3098
3099
3100
3101
3102
3103
3104
3105
3106
3107
3108
3109
3110
3111
3112
3113
3114
3115
3116
3117
3118
3119
3120
3121
3122
3123
3124
3125
3126
3127
3128
3129
3130
3131
3132
3133
3134
3135
3136
3137
3138
3139
3140
3141
3142
3143
3144
3145
3146
3147
3148
3149
3150
3151
3152
3153
3154
3155
3156
3157
3158
3159
3160
3161
3162
3163
3164
3165
3166
3167
3168
3169
3170
3171
3172
3173
3174
3175
3176
3177
3178
3179
3180
3181
3182
3183
3184
3185
3186
3187
3188
3189
3190
3191
3192
3193
3194
3195
3196
3197
3198
3199
3200
3201
3202
3203
3204
3205
3206
3207
3208
3209
3210
3211
3212
3213
3214
3215
3216
3217
3218
3219
3220
3221
3222
3223
3224
3225
3226
3227
3228
3229
3230
3231
3232
3233
3234
3235
3236
3237
3238
3239
3240
3241
3242
3243
3244
3245
3246
3247
3248
3249
3250
3251
3252
3253
3254
3255
3256
3257
3258
3259
3260
3261
3262
3263
3264
3265
3266
3267
3268
3269
3270
3271
3272
3273
3274
3275
3276
3277
3278
3279
3280
3281
3282
3283
3284
3285
3286
3287
3288
3289
3290
3291
3292
3293
3294
3295
3296
3297
3298
3299
3300
3301
3302
3303
3304
3305
3306
3307
3308
3309
3310
3311
3312
3313
3314
3315
3316
3317
3318
3319
3320
3321
3322
3323
3324
3325
3326
3327
3328
3329
3330
3331
3332
3333
3334
3335
3336
3337
3338
3339
3340
3341
3342
3343
3344
3345
3346
3347
3348
3349
3350
3351
3352
3353
3354
3355
3356
3357
3358
3359
3360
3361
3362
3363
3364
3365
3366
3367
3368
3369
3370
3371
3372
3373
3374
3375
3376
3377
3378
3379
3380
3381
3382
3383
3384
3385
3386
3387
3388
3389
3390
3391
3392
3393
3394
3395
3396
3397
3398
3399
3400
3401
3402
3403
3404
3405
3406
3407
3408
3409
3410
3411
3412
3413
3414
3415
3416
3417
3418
3419
3420
3421
3422
3423
3424
3425
3426
3427
3428
3429
3430
3431
3432
3433
3434
3435
3436
3437
3438
3439
3440
3441
3442
3443
3444
3445
3446
3447
3448
3449
3450
3451
3452
3453
3454
3455
3456
3457
3458
3459
3460
3461
3462
3463
3464
3465
3466
3467
3468
3469
3470
3471
3472
3473
3474
3475
3476
3477
3478
3479
3480
3481
3482
3483
3484
3485
3486
3487
3488
3489
3490
3491
3492
3493
3494
3495
3496
3497
3498
3499
3500
3501
3502
3503
3504
3505
3506
3507
3508
3509
3510
3511
3512
3513
3514
3515
3516
3517
3518
3519
3520
3521
3522
3523
3524
3525
3526
3527
3528
3529
3530
3531
3532
3533
3534
3535
3536
3537
3538
3539
3540
3541
3542
3543
3544
3545
3546
3547
3548
3549
3550
3551
3552
3553
3554
3555
3556
3557
3558
3559
3560
3561
3562
3563
3564
3565
3566
3567
3568
3569
3570
3571
3572
3573
3574
3575
3576
3577
3578
3579
3580
3581
3582
3583
3584
3585
3586
3587
3588
3589
3590
3591
3592
3593
3594
3595
3596
3597
3598
3599
3600
3601
3602
3603
3604
3605
3606
3607
3608
3609
3610
3611
3612
3613
3614
3615
3616
3617
3618
3619
3620
3621
3622
3623
3624
3625
3626
3627
3628
3629
3630
3631
3632
3633
3634
3635
3636
3637
3638
3639
3640
3641
3642
3643
3644
3645
3646
3647
3648
3649
3650
3651
3652
3653
3654
3655
3656
3657
3658
3659
3660
3661
3662
3663
3664
3665
3666
3667
3668
3669
3670
3671
3672
3673
3674
3675
3676
3677
3678
3679
3680
3681
3682
3683
3684
3685
3686
3687
3688
3689
3690
3691
3692
3693
3694
3695
3696
3697
3698
3699
3700
3701
3702
3703
3704
3705
3706
3707
3708
3709
3710
3711
3712
3713
3714
3715
3716
3717
3718
3719
3720
3721
3722
3723
3724
3725
3726
3727
3728
3729
3730
3731
3732
3733
3734
3735
3736
3737
3738
3739
3740
3741
3742
3743
3744
3745
3746
3747
3748
3749
3750
3751
3752
3753
3754
3755
3756
3757
3758
3759
3760
3761
3762
3763
3764
3765
3766
3767
3768
3769
3770
3771
3772
3773
3774
3775
3776
3777
3778
3779
3780
3781
3782
3783
3784
3785
3786
3787
3788
3789
3790
3791
3792
3793
3794
3795
3796
3797
3798
3799
3800
3801
3802
3803
3804
3805
3806
3807
3808
3809
3810
3811
3812
3813
3814
3815
3816
3817
3818
3819
3820
3821
3822
3823
3824
3825
3826
3827
3828
3829
3830
3831
3832
3833
3834
3835
3836
3837
3838
3839
3840
3841
3842
3843
3844
3845
3846
3847
3848
3849
3850
3851
3852
3853
3854
3855
3856
3857
3858
3859
3860
3861
3862
3863
3864
3865
3866
3867
3868
3869
3870
3871
3872
3873
3874
3875
3876
3877
3878
3879
3880
3881
3882
3883
3884
3885
3886
3887
3888
3889
3890
3891
3892
3893
3894
3895
3896
3897
3898
3899
3900
3901
3902
3903
3904
3905
3906
3907
3908
3909
3910
3911
3912
3913
3914
3915
3916
3917
3918
3919
3920
3921
3922
3923
3924
3925
3926
3927
3928
3929
3930
3931
3932
3933
3934
3935
3936
3937
3938
3939
3940
3941
3942
3943
3944
3945
3946
3947
3948
3949
3950
3951
3952
3953
3954
3955
3956
3957
3958
3959
3960
3961
3962
3963
3964
3965
3966
3967
3968
3969
3970
3971
3972
3973
3974
3975
3976
3977
3978
3979
3980
3981
3982
3983
3984
3985
3986
3987
3988
3989
3990
3991
3992
3993
3994
3995
3996
3997
3998
3999
4000
4001
4002
4003
4004
4005
4006
4007
4008
4009
4010
4011
4012
4013
4014
4015
4016
4017
4018
4019
4020
4021
4022
4023
4024
4025
4026
4027
4028
4029
4030
4031
4032
4033
4034
4035
4036
4037
4038
4039
4040
4041
4042
4043
4044
4045
4046
4047
4048
4049
4050
4051
4052
4053
4054
4055
4056
4057
4058
4059
4060
4061
4062
4063
4064
4065
4066
4067
4068
4069
4070
4071
4072
4073
4074
4075
4076
4077
4078
4079
4080
4081
4082
4083
4084
4085
4086
4087
4088
4089
4090
4091
4092
4093
4094
4095
4096
4097
4098
4099
4100
4101
4102
4103
4104
4105
4106
4107
4108
4109
4110
4111
4112
4113
4114
4115
4116
4117
4118
4119
4120
4121
4122
4123
4124
4125
4126
4127
4128
4129
4130
4131
4132
4133
4134
4135
4136
4137
4138
4139
4140
4141
4142
4143
4144
4145
4146
4147
4148
4149
4150
4151
4152
4153
4154
4155
4156
4157
4158
4159
4160
4161
4162
4163
4164
4165
4166
4167
4168
4169
4170
4171
4172
4173
4174
4175
4176
4177
4178
4179
4180
4181
4182
4183
4184
4185
4186
4187
4188
4189
4190
4191
4192
4193
4194
4195
4196
4197
4198
4199
4200
4201
4202
4203
4204
4205
4206
4207
4208
4209
4210
4211
4212
4213
4214
4215
4216
4217
4218
4219
4220
4221
4222
4223
4224
4225
4226
4227
4228
4229
4230
4231
4232
4233
4234
4235
4236
4237
4238
4239
4240
4241
4242
4243
4244
4245
4246
4247
4248
4249
4250
4251
4252
4253
4254
4255
4256
4257
4258
4259
4260
4261
4262
4263
4264
4265
4266
4267
4268
4269
4270
4271
4272
4273
4274
4275
4276
4277
4278
4279
4280
4281
4282
4283
4284
4285
4286
4287
4288
4289
4290
4291
4292
4293
4294
4295
4296
4297
4298
4299
4300
4301
4302
4303
4304
4305
4306
4307
4308
4309
4310
4311
4312
4313
4314
4315
4316
4317
4318
4319
4320
4321
4322
4323
4324
4325
4326
4327
4328
4329
4330
4331
4332
4333
4334
4335
4336
4337
4338
4339
4340
4341
4342
4343
4344
4345
4346
4347
4348
4349
4350
4351
4352
4353
4354
4355
4356
4357
4358
4359
4360
4361
4362
4363
4364
4365
4366
4367
4368
4369
4370
4371
4372
4373
4374
4375
4376
4377
4378
4379
4380
4381
4382
4383
4384
4385
4386
4387
4388
4389
4390
4391
4392
4393
4394
4395
4396
4397
4398
4399
4400
4401
4402
4403
4404
4405
4406
4407
4408
4409
4410
4411
4412
4413
4414
4415
4416
4417
4418
4419
4420
4421
4422
4423
4424
4425
4426
4427
4428
4429
4430
4431
4432
4433
4434
4435
4436
4437
4438
4439
4440
4441
4442
4443
4444
4445
4446
4447
4448
4449
4450
4451
4452
4453
4454
4455
4456
4457
4458
4459
4460
4461
4462
4463
4464
4465
4466
4467
4468
4469
4470
4471
4472
4473
4474
4475
4476
4477
4478
4479
4480
4481
4482
4483
4484
4485
4486
4487
4488
4489
4490
4491
4492
4493
4494
4495
4496
4497
4498
4499
4500
4501
4502
4503
4504
4505
4506
4507
4508
4509
4510
4511
4512
4513
4514
4515
4516
4517
4518
4519
4520
4521
4522
4523
4524
4525
4526
4527
4528
4529
4530
4531
4532
4533
4534
4535
4536
4537
4538
4539
4540
4541
4542
4543
4544
4545
4546
4547
4548
4549
4550
4551
4552
4553
4554
4555
4556
4557
4558
4559
4560
4561
4562
4563
4564
4565
4566
4567
4568
4569
4570
4571
4572
4573
4574
4575
4576
4577
4578
4579
4580
4581
4582
4583
4584
4585
4586
4587
4588
4589
4590
4591
4592
4593
4594
4595
4596
4597
4598
4599
4600
4601
4602
4603
4604
4605
4606
4607
4608
4609
4610
4611
4612
4613
4614
4615
4616
4617
4618
4619
4620
4621
4622
4623
4624
4625
4626
4627
4628
4629
4630
4631
4632
4633
4634
4635
4636
4637
4638
4639
4640
4641
4642
4643
4644
4645
4646
4647
4648
4649
4650
4651
4652
4653
4654
4655
4656
4657
4658
4659
4660
4661
4662
4663
4664
4665
4666
4667
4668
4669
4670
4671
4672
4673
4674
4675
4676
4677
4678
4679
4680
4681
4682
4683
4684
4685
4686
4687
4688
4689
4690
4691
4692
4693
4694
4695
4696
4697
4698
4699
4700
4701
4702
4703
4704
4705
4706
4707
4708
4709
4710
4711
4712
4713
4714
4715
4716
4717
4718
4719
4720
4721
4722
4723
4724
4725
4726
4727
4728
4729
4730
4731
4732
4733
4734
4735
4736
4737
4738
4739
4740
4741
4742
4743
4744
4745
4746
4747
4748
4749
4750
4751
4752
4753
4754
4755
4756
4757
4758
4759
4760
4761
4762
4763
4764
4765
4766
4767
4768
4769
4770
4771
4772
4773
4774
4775
4776
4777
4778
4779
4780
4781
4782
4783
4784
4785
4786
4787
4788
4789
4790
4791
4792
4793
4794
4795
4796
4797
4798
4799
4800
4801
4802
4803
4804
4805
4806
4807
4808
4809
4810
4811
4812
4813
4814
4815
4816
4817
4818
4819
4820
4821
4822
4823
4824
4825
4826
4827
4828
4829
4830
4831
4832
4833
4834
4835
4836
4837
4838
4839
4840
4841
4842
4843
4844
4845
4846
4847
4848
4849
4850
4851
4852
4853
4854
4855
4856
4857
4858
4859
4860
4861
4862
4863
4864
4865
4866
4867
4868
4869
4870
4871
4872
4873
4874
4875
4876
4877
4878
4879
4880
4881
4882
4883
4884
4885
4886
4887
4888
4889
4890
4891
4892
4893
4894
4895
4896
4897
4898
4899
4900
4901
4902
4903
4904
4905
4906
4907
4908
4909
4910
4911
4912
4913
4914
4915
4916
4917
4918
4919
4920
4921
4922
4923
4924
4925
4926
4927
4928
4929
4930
4931
4932
4933
4934
4935
4936
4937
4938
4939
4940
4941
4942
4943
4944
4945
4946
4947
4948
4949
4950
4951
4952
4953
4954
4955
4956
4957
4958
4959
4960
4961
4962
4963
4964
4965
4966
4967
4968
4969
4970
4971
4972
4973
4974
4975
4976
4977
4978
4979
4980
4981
4982
4983
4984
4985
4986
4987
4988
4989
4990
4991
4992
4993
4994
4995
4996
4997
4998
4999
5000
5001
5002
5003
5004
5005
5006
5007
5008
5009
5010
5011
5012
5013
5014
5015
5016
5017
5018
5019
5020
5021
5022
5023
5024
5025
5026
5027
5028
5029
5030
5031
5032
5033
5034
5035
5036
5037
5038
5039
5040
5041
5042
5043
5044
5045
5046
5047
5048
5049
5050
5051
5052
5053
5054
5055
5056
5057
5058
5059
5060
5061
5062
5063
5064
5065
5066
5067
5068
5069
5070
5071
5072
5073
5074
5075
5076
5077
5078
5079
5080
5081
5082
5083
5084
5085
5086
5087
5088
5089
5090
5091
5092
5093
5094
5095
5096
5097
5098
5099
5100
5101
5102
5103
5104
5105
5106
5107
5108
5109
5110
5111
5112
5113
5114
5115
5116
5117
5118
5119
5120
5121
5122
5123
5124
5125
5126
5127
5128
5129
5130
5131
5132
5133
5134
5135
5136
5137
5138
5139
5140
5141
5142
5143
5144
5145
5146
5147
5148
5149
5150
5151
5152
5153
5154
5155
5156
5157
5158
5159
5160
5161
5162
5163
5164
5165
5166
5167
5168
5169
5170
5171
5172
5173
5174
5175
5176
5177
5178
5179
5180
5181
5182
5183
5184
5185
5186
5187
5188
5189
5190
5191
5192
5193
5194
5195
5196
5197
5198
5199
5200
5201
5202
5203
5204
5205
5206
5207
5208
5209
5210
5211
5212
5213
5214
5215
5216
5217
5218
5219
5220
5221
5222
5223
5224
5225
5226
5227
5228
5229
5230
5231
5232
5233
5234
5235
5236
5237
5238
5239
5240
5241
5242
5243
5244
5245
5246
5247
5248
5249
5250
5251
5252
5253
5254
5255
5256
5257
5258
5259
5260
5261
5262
5263
5264
5265
5266
5267
5268
5269
5270
5271
5272
5273
5274
5275
5276
5277
5278
5279
5280
5281
5282
5283
5284
5285
5286
5287
5288
5289
5290
5291
5292
5293
5294
5295
5296
5297
5298
5299
5300
5301
5302
5303
5304
5305
5306
5307
5308
5309
5310
5311
5312
5313
5314
5315
5316
5317
5318
5319
5320
5321
5322
5323
5324
5325
5326
5327
5328
5329
5330
5331
5332
5333
5334
5335
5336
5337
5338
5339
5340
5341
5342
5343
5344
5345
5346
5347
5348
5349
5350
5351
5352
5353
5354
5355
5356
5357
5358
5359
5360
5361
5362
5363
5364
5365
5366
5367
5368
5369
5370
5371
5372
5373
5374
5375
5376
5377
5378
5379
5380
5381
5382
5383
5384
5385
5386
5387
5388
5389
5390
5391
5392
5393
5394
5395
5396
5397
5398
5399
5400
5401
5402
5403
5404
5405
5406
5407
5408
5409
5410
5411
5412
5413
5414
5415
5416
5417
5418
5419
5420
5421
5422
5423
5424
5425
5426
5427
5428
5429
5430
5431
5432
5433
5434
5435
5436
5437
5438
5439
5440
5441
5442
5443
5444
5445
5446
5447
5448
5449
5450
5451
5452
5453
5454
5455
5456
5457
5458
5459
5460
5461
5462
5463
5464
5465
5466
5467
5468
5469
5470
5471
5472
5473
5474
5475
5476
5477
5478
5479
5480
5481
5482
5483
5484
5485
5486
5487
5488
5489
5490
5491
5492
5493
5494
5495
5496
5497
5498
5499
5500
5501
5502
5503
5504
5505
5506
5507
5508
5509
5510
5511
5512
5513
5514
5515
5516
5517
5518
5519
5520
5521
5522
5523
5524
5525
5526
5527
5528
5529
5530
5531
5532
5533
5534
5535
5536
5537
5538
5539
5540
5541
5542
5543
5544
5545
5546
5547
5548
5549
5550
5551
5552
5553
5554
5555
5556
5557
5558
5559
5560
5561
5562
5563
5564
5565
5566
5567
5568
5569
5570
5571
5572
5573
5574
5575
5576
5577
5578
5579
5580
5581
5582
5583
5584
5585
5586
5587
5588
5589
5590
5591
5592
5593
5594
5595
5596
5597
5598
5599
5600
5601
5602
5603
5604
5605
5606
5607
5608
5609
5610
5611
5612
5613
5614
5615
5616
5617
5618
5619
5620
5621
5622
5623
5624
5625
5626
5627
5628
5629
5630
5631
5632
5633
5634
5635
5636
5637
5638
5639
5640
5641
5642
5643
5644
5645
5646
5647
5648
5649
5650
5651
5652
5653
5654
5655
5656
5657
5658
5659
5660
5661
5662
5663
5664
5665
5666
5667
5668
5669
5670
5671
5672
5673
5674
5675
5676
5677
5678
5679
5680
5681
5682
5683
5684
5685
5686
5687
5688
5689
5690
5691
5692
5693
5694
5695
5696
5697
5698
5699
5700
5701
5702
5703
5704
5705
5706
5707
5708
5709
5710
5711
5712
5713
5714
5715
5716
5717
5718
5719
5720
5721
5722
5723
5724
5725
5726
5727
5728
5729
5730
5731
5732
5733
5734
5735
5736
5737
5738
5739
5740
5741
5742
5743
5744
5745
5746
5747
5748
5749
5750
5751
5752
5753
5754
5755
5756
5757
5758
5759
5760
5761
5762
5763
5764
5765
5766
5767
5768
5769
5770
5771
5772
5773
5774
5775
5776
5777
5778
5779
5780
5781
5782
5783
5784
5785
5786
5787
5788
5789
5790
5791
5792
5793
5794
5795
5796
5797
5798
5799
5800
5801
5802
5803
5804
5805
5806
5807
5808
5809
5810
5811
5812
5813
5814
5815
5816
5817
5818
5819
5820
5821
5822
5823
5824
5825
5826
5827
5828
5829
5830
5831
5832
5833
5834
5835
5836
5837
5838
5839
5840
5841
5842
5843
5844
5845
5846
5847
5848
5849
5850
5851
5852
5853
5854
5855
class ArrayGlyph(GeoMixin, Glyph):
    """A class to handle arrays and perform various visualization operations on them.

    The ArrayGlyph class provides functionality for visualizing 2D and 3D arrays with
    various customization options. It supports plotting single arrays, RGB arrays,
    and creating animations from 3D arrays.

    Attributes:
        fig (matplotlib.figure.Figure): The matplotlib figure object.
        ax (matplotlib.axes.Axes): The matplotlib axes object.
        extent (List): The extent of the array [xmin, xmax, ymin, ymax].
        rgb (bool): Whether the array is an RGB array.
        num_domain_cells (int): Number of cells in the data domain — cells
            that are neither masked (via `exclude_value`) nor NaN. A stack
            (3-D `(n, h, w)` grey or 4-D `(n, h, w, 3)`) is counted on its first
            frame; a single frame (2-D, or an `(h, w, 3)` RGB image from
            `rgb_bands`) is counted whole. For a single-band frame it equals the
            number of per-cell value labels drawn when `display_cell_value=True`;
            for multi-channel RGB data it counts elements and is informational
            (RGB renders draw no per-cell labels).
        anim (matplotlib.animation.FuncAnimation): The animation object if created.
        im (matplotlib.cm.ScalarMappable): The colour-mapped artist produced by
            the most recent `plot`/`animate` call (e.g. the `AxesImage` for
            `imshow`, the `QuadMesh` for `pcolormesh`, the `QuadContourSet`
            for `contour`/`contourf`, or the RGB `AxesImage`). `None` before
            the first render. Lets a caller attach a colorbar/legend or query
            the colour limits without scraping `ax.images`/`ax.collections`.
        cbar (matplotlib.colorbar.Colorbar): The colorbar drawn by the glyph,
            or `None` when none was drawn (RGB, or `add_colorbar=False`).
        contour_labels (list): The inline contour-label `Text` artists from
            the most recent `plot(kind="contour", labels=True)`, or `None`
            when labelling was not requested (the default, and for every
            kind other than `"contour"`). A labelled contour with no
            isolines (e.g. a constant-value field) yields an empty list.

    Notes:
        This class provides methods for:
        - Plotting arrays with customizable color scales, color bars, and annotations
        - Creating animations from 3D arrays
        - Displaying point values on arrays
        - Customizing plot appearance

    Examples:
    - Create a simple array plot:
        ```python
        >>> import numpy as np
        >>> from cleopatra.glyphs.gridded.array_glyph import ArrayGlyph
        >>> arr = np.array([[1, 2, 3], [4, 5, 6], [7, 8, 9]])
        >>> array_glyph = ArrayGlyph(arr)
        >>> fig, ax = array_glyph.plot()

        ```
    - Create an RGB plot from a 3D array:
    ```python
    >>> from cleopatra.glyphs.gridded.array_glyph import RgbBands
    >>> rgb_array = np.random.randint(0, 255, size=(3, 10, 10))
    >>> rgb_glyph = ArrayGlyph(rgb_array, rgb_bands=RgbBands([0, 1, 2]))
    >>> fig, ax = rgb_glyph.plot()

    ```
    - Create an animated plot from a 3D array:
    ```python
    >>> time_series = np.random.randint(1, 10, size=(5, 10, 10))
    >>> time_labels = ["Frame 1", "Frame 2", "Frame 3", "Frame 4", "Frame 5"]
    >>> animated_glyph = ArrayGlyph(time_series)
    >>> anim = animated_glyph.animate(time_labels)

    ```
    """

    #: Option keys this glyph accepts (see `Glyph.option_keys`/`filter_kwargs`).
    DEFAULT_OPTIONS = ARRAY_DEFAULT_OPTIONS

    @staticmethod
    def _count_domain_cells(array: np.ndarray, is_rgb: bool) -> int:
        """Count the in-domain cells -- neither `exclude_value`-masked nor NaN.

        Replaces the old `len(get_indices2(frame, [np.nan]))`, which allocated
        one Python tuple per cell (O(n) objects that raised `MemoryError` on a
        large animation stack). A stack (3-D `(n, h, w)` grey or 4-D
        `(n, h, w, 3)`) is counted on frame 0; a single frame -- 2-D, or an
        `(h, w, 3)` RGB image from `rgb_bands` (also 3-D) -- is counted whole.

        Args:
            array: The already-masked input array (an `ma.array`).
            is_rgb: Whether `array` is a single band-last RGB image.

        Returns:
            int: The number of in-domain cells on the counted frame.
        """
        first_frame = array if (is_rgb or array.ndim < 3) else array[0]
        in_domain = ~(ma.getmaskarray(first_frame) | np.isnan(ma.getdata(first_frame)))
        return int(np.count_nonzero(in_domain))

    def __init__(
        self,
        array: np.ndarray,
        exclude_value: float | list = np.nan,
        extent: list | None = None,
        coords: tuple[np.ndarray, np.ndarray] | list[np.ndarray] | None = None,
        rgb_bands: RgbBands | None = None,
        ax: Axes | None = None,
        fig: Figure | None = None,
        **kwargs,
    ):
        """Initialize the ArrayGlyph object with an array and optional parameters.

        Args:
            array: The array to be visualized. Can be a 2D array for single plots or a 3D array for RGB plots or animations.
            exclude_value: Value(s) used to mask cells out of the domain, by default np.nan.
                Can be a single value or a list of values to exclude.
            extent: The extent of the array in the format [xmin, ymin, xmax, ymax], by default None.
                If provided, the array will be plotted with these spatial boundaries.
                Mutually exclusive with `coords`.
            coords: Optional `(x, y)` coordinate arrays for curvilinear
                or non-uniform grids, by default None. Each element is
                either a 1-D array of cell centres (length matches the
                last/second-to-last axis of `array`) or a 2-D array
                matching the last two axes of `array`. When set,
                `kind="auto"` routes to `pcolormesh` instead of
                `imshow`. Mutually exclusive with `extent`.
            rgb_bands: An `RgbBands` bundling the band indices and stretch for
                an RGB image, by default None. When given, the array is treated
                as band-first and composited to RGB via `RgbBands.prepare`
                (band selection plus a percentile / surface-reflectance / cutoff
                stretch). Replaces the former loose `rgb`, `surface_reflectance`,
                `cutoff`, and `percentile` keywords.
            ax: A pre-existing axes to plot on, by default None. Bound to
                the glyph and used by `plot`/`animate` unless `plot(ax=...)`
                overrides it. Passing `ax` alone is enough — its parent
                figure is derived automatically; if None (and no axes is
                given to `plot`), a new axes is created.
            fig: A pre-existing figure to bind, by default None. `fig` is a
                construction-time binding only (it is never a `plot`
                parameter — `plot` derives the figure from its axes). When
                `ax` is given, `fig` is optional; if both are None a new
                figure is created at render time. Passing `fig` alone (no
                `ax`) draws into that figure — its first axes, or a fresh
                one if it has none.
            **kwargs: Additional keyword arguments for customizing the plot.
                Supported arguments include:
                    figsize : tuple, optional
                        Figure size, by default (8, 8).
                    vmin : float, optional
                        Minimum value for color scaling, by default min(array).
                    vmax : float, optional
                        Maximum value for color scaling, by default max(array).
                    title : str, optional
                        Title of the plot, by default 'Array Plot'.
                    title_size : int, optional
                        Title font size, by default 15.
                    cmap : str or matplotlib.colors.Colormap, optional
                        Colormap, by default 'coolwarm_r'. A plain matplotlib
                        name (e.g. 'viridis') or a `Colormap` object is used
                        as-is; a **namespaced** name such as 'cmocean:thermal'
                        or 'cmasher:ember' is resolved via the optional `cmap`
                        aggregator — install the `[science-colors]` extra
                        (`pip install cleopatra[science-colors]`). The `_r`
                        reverse suffix works on both forms.
                    kind : str, optional
                        Render kind. One of `"auto"`, `"imshow"`,
                        `"pcolormesh"`, `"contour"`, `"contourf"`.
                        Default `"auto"` (currently equivalent to
                        `"imshow"`). Stored on the instance and used
                        as the default for `plot`.
                    robust : bool, optional
                        When True, `vmin` / `vmax` are computed from
                        the 2nd and 98th percentile of the unmasked data
                        (xarray-aligned). An explicit `vmin` / `vmax`
                        wins over `robust`. Default False.
                    center : float, optional
                        Diverging-colormap centring value. When set,
                        `(vmin, vmax)` is made symmetric around
                        `center` and the cmap auto-switches to
                        `"RdBu_r"` if no explicit `cmap` was passed.
                        Default None (no centring).
                    levels : int or sequence, optional
                        Discrete colour levels (xarray-aligned). An
                        `int` selects N linearly-spaced edges between
                        `vmin` and `vmax`; a sequence is used as
                        explicit edges. Default None.
                    extend : str, optional
                        Colorbar arrow extension. One of `"neither"`,
                        `"both"`, `"min"`, `"max"`, or None to
                        auto-resolve at render time. Default None.
                    cbar_kwargs : dict, optional
                        Extra keyword arguments forwarded to
                        `fig.colorbar`; user keys win over cleopatra's
                        defaults on collision. Default None.
            data_style: Grouped `style` / `hillshade` / `bands` / `alpha` / `alpha_range` options applied at
                construction, e.g. `data_style=DataStyle(style="topography")`.
                These are rejected as loose keywords, so the group is how they
                are set here rather than on every `plot()` call; the value is
                sticky across later calls. Default None.

        Raises:
            ValueError: If an invalid keyword argument is provided.
            ValueError: If `rgb_bands` is given but the array has fewer than
                3 bands.
            ValueError: If `extend` is set to a value outside
                `{"neither", "both", "min", "max"}`.
            ValueError: If both `extent` and `coords` are supplied,
                or if a `coords` element has a shape that does not
                match `array`.
            TypeError: If `coords` is not a length-2 sequence of
                ndarrays.

        Examples:
        Basic initialization with a 2D array:
        ```python
        >>> import numpy as np
        >>> from cleopatra.glyphs.gridded.array_glyph import ArrayGlyph
        >>> arr = np.array([[1, 2, 3], [4, 5, 6], [7, 8, 9]])
        >>> array_glyph = ArrayGlyph(arr)
        >>> fig, ax = array_glyph.plot()

        ```
        Initialization with custom figure size and title:
        ```python
        >>> array_glyph = ArrayGlyph(arr, figsize=(10, 8), title="Custom Array Plot")
        >>> fig, ax = array_glyph.plot()

        ```
        Initialization with RGB bands from a 3D array:
        ```python
        >>> from cleopatra.glyphs.gridded.array_glyph import RgbBands
        >>> rgb_array = np.random.randint(0, 255, size=(3, 10, 10))
        >>> rgb_glyph = ArrayGlyph(
        ...     rgb_array, rgb_bands=RgbBands([0, 1, 2], surface_reflectance=255)
        ... )
        >>> fig, ax = rgb_glyph.plot()

        ```
        Initialization with custom extent:
        ```python
        >>> array_glyph = ArrayGlyph(arr, extent=[0, 0, 10, 10])
        >>> fig, ax = array_glyph.plot()

        ```
        Robust colour limits (xarray-aligned `robust=True` clips the
        2nd/98th percentile so a few outliers do not dominate the
        scale):
        ```python
        >>> import numpy as np
        >>> from cleopatra.glyphs.gridded.array_glyph import ArrayGlyph
        >>> data = np.arange(100, dtype=float).reshape(10, 10)
        >>> data[0, 0] = 1e6  # outlier
        >>> glyph = ArrayGlyph(data, robust=True)
        >>> round(glyph.vmin, 1), round(glyph.vmax, 1)
        (3.0, 98.0)

        ```
        Centring on a value for diverging data (auto-switches the cmap
        to `"RdBu_r"` when no `cmap` is passed):
        ```python
        >>> import numpy as np
        >>> from cleopatra.glyphs.gridded.array_glyph import ArrayGlyph
        >>> anomaly = np.linspace(-3.0, 8.0, 25).reshape(5, 5)
        >>> glyph = ArrayGlyph(anomaly, center=0.0)
        >>> glyph.vmin, glyph.vmax
        (-8.0, 8.0)
        >>> glyph.default_options["cmap"]
        'RdBu_r'

        ```
        Combining `levels`, `extend` and `cbar_kwargs` (forwarded
        to `matplotlib.colorbar.Colorbar`):
        ```python
        >>> import numpy as np
        >>> from cleopatra.glyphs.gridded.array_glyph import ArrayGlyph
        >>> arr = np.arange(25, dtype=float).reshape(5, 5)
        >>> glyph = ArrayGlyph(
        ...     arr,
        ...     extend="both",
        ...     cbar_kwargs={"shrink": 0.6},
        ... )
        >>> glyph.default_options["extend"]
        'both'
        >>> glyph.default_options["cbar_kwargs"]
        {'shrink': 0.6}

        ```
        Invalid `extend` is rejected at construction time:
        ```python
        >>> import numpy as np
        >>> from cleopatra.glyphs.gridded.array_glyph import ArrayGlyph
        >>> ArrayGlyph(np.array([[0.0, 1.0]]), extend="up")
        Traceback (most recent call last):
            ...
        ValueError: Invalid extend='up'. Valid values are ('neither', 'both', 'min', 'max') or None.

        ```
        Curvilinear coords (1-D centres) auto-route to
        `pcolormesh`:
        ```python
        >>> import numpy as np
        >>> from cleopatra.glyphs.gridded.array_glyph import ArrayGlyph
        >>> arr = np.arange(12, dtype=float).reshape(3, 4)
        >>> x = np.linspace(0.0, 10.0, 4)
        >>> y = np.linspace(0.0, 5.0, 3)
        >>> glyph = ArrayGlyph(arr, coords=(x, y))
        >>> glyph.coords[0].shape, glyph.coords[1].shape
        ((4,), (3,))

        ```
        `extent` and `coords` are mutually exclusive:
        ```python
        >>> import numpy as np
        >>> from cleopatra.glyphs.gridded.array_glyph import ArrayGlyph
        >>> arr = np.zeros((3, 4))
        >>> x = np.linspace(0.0, 10.0, 4)
        >>> y = np.linspace(0.0, 5.0, 3)
        >>> ArrayGlyph(arr, extent=[0, 0, 1, 1], coords=(x, y))
        Traceback (most recent call last):
            ...
        ValueError: `extent` and `coords` are mutually exclusive — pass one or the other.

        ```
        """
        _reject_loose_alpha(kwargs)
        _reject_loose_fill(kwargs)
        super().__init__(
            default_options=ARRAY_DEFAULT_OPTIONS, fig=fig, ax=ax, **kwargs
        )
        if exclude_value is not np.nan:
            values = cast(list, exclude_value)
            if len(values) > 1:
                mask = np.logical_or(
                    np.isclose(array, values[0], rtol=0.001),
                    np.isclose(array, values[1], rtol=0.001),
                )
            else:
                mask = np.isclose(array, values[0], rtol=0.0000001)
            array = ma.array(array, mask=mask, dtype=array.dtype)
        else:
            array = ma.array(array)

        # convert the extent from [xmin, ymin, xmax, ymax] to [xmin, xmax, ymin, ymax] as required by matplotlib.
        if extent is not None and coords is not None:
            raise ValueError(
                "`extent` and `coords` are mutually exclusive — pass one or the other."
            )
        if extent is not None:
            extent = [extent[0], extent[2], extent[1], extent[3]]
        self.extent = extent

        self._coords = self._validate_coords(coords, array)

        if rgb_bands is not None:
            self.rgb = True
            rgb_bands.validate(array)
            array = rgb_bands.prepare(array)
        else:
            self.rgb = False

        self._exclude_value = exclude_value
        self._validate_extend(self.default_options.get("extend"))

        explicit_keys = set(kwargs.keys())
        self._style_color_overrides: dict[str, Any] = {
            key: kwargs[key]
            for key in _STYLE_OVERRIDE_KEYS
            if key in explicit_keys and kwargs[key] is not None
        }
        #: Whether the latest plot()/animate() call explicitly requested a real
        #: colorbar (a truthy `colorbar=`), which overrides a preset's swatch.
        self._style_wants_colorbar: bool = False
        self._vmin, self._vmax = self._resolve_color_limits(
            array,
            vmin_kw=kwargs.get("vmin"),
            vmax_kw=kwargs.get("vmax"),
            robust=bool(self.default_options.get("robust", False)),
            center=self.default_options.get("center"),
            vmin_explicit="vmin" in explicit_keys,
            vmax_explicit="vmax" in explicit_keys,
        )
        #: Whether the caller pinned `vmin` themselves. A log scale floors an
        #: un-pinned `vmin` at the smallest positive non-outlier (see
        #: `_log_safe_vmin`); an explicit `vmin` must still win.
        self._vmin_explicit: bool = "vmin" in explicit_keys
        if (
            self.default_options.get("center") is not None
            and "cmap" not in explicit_keys
        ):
            self.default_options["cmap"] = DIVERGING_DEFAULT_CMAP

        self._arr = array
        self.ticks_spacing = (self._vmax - self._vmin) / 10 or 1.0
        self.num_domain_cells = self._count_domain_cells(array, self.rgb)
        self.im: Any = None
        self.cbar: Colorbar | None = None
        self._day_text: Any = None
        self.contour_labels: list[Any] | None = None

    @property
    def arr(self):
        """The (masked) array held by the glyph.

        The array is stored as a `numpy.ma.MaskedArray`; cells matching
        `exclude_value` (or NaN) are masked so they are excluded from the
        colour range and rendered as gaps.

        Returns:
            numpy.ma.MaskedArray: The array backing this glyph.

        Examples:
            - Read the array back and inspect its shape and a value:
                ```python
                >>> import numpy as np
                >>> from cleopatra.glyphs.gridded.array_glyph import ArrayGlyph
                >>> glyph = ArrayGlyph(np.array([[1.0, 2.0, 3.0], [4.0, 5.0, 6.0]]))
                >>> glyph.arr.shape
                (2, 3)
                >>> float(glyph.arr[0, 0])
                1.0

                ```
        """
        return self._arr

    @arr.setter
    def arr(self, value):
        """Set the backing array.

        Args:
            value: The new array to store (see the `arr` property).
        """
        self._arr = value

    def _scale_values(self) -> np.ndarray:
        """The array's valid, finite cells, for a data-driven scale (`equalize`).

        Drops masked (out-of-domain) cells and any non-finite values, and
        flattens the whole stored array to 1-D -- so for a 3-D stack /
        animation the empirical CDF is built once from *all* frames, giving a
        single scale consistent across them rather than a per-frame one.

        Always returns an array (never `None`): an all-non-finite field yields
        an empty array, so `equalize` reports the accurate "no finite values"
        error rather than the base glyph's "no value array" message.

        Returns:
            np.ndarray: A 1-D array of finite in-domain values (empty if none).
        """
        arr = ma.asarray(self.arr)
        values = np.asarray(arr.compressed(), dtype=float).ravel()
        return values[np.isfinite(values)]

    def prepare_array(
        self,
        array: np.ndarray,
        rgb: list[int] | None = None,
        surface_reflectance: int | None = None,
        cutoff: list | None = None,
        percentile: int | None = None,
    ) -> np.ndarray:
        """Prepare an array for RGB visualization.

        This method processes a multi-band array to create an RGB image suitable for visualization.
        It can normalize the data using either percentile-based scaling or surface reflectance values.

        Args:
            array: The input array containing multiple bands. For RGB visualization,
                this should be a 3D array where the first dimension represents the bands.
            rgb: The `[r, g, b]` indices of the bands to composite from the input
                array. Provide the band indices explicitly; there is no
                functional default -- a missing `rgb` does not select bands.
            surface_reflectance: Surface reflectance value for normalizing satellite data, by default None.
                Typically 10000 for Sentinel-2 data or 255 for 8-bit imagery.
                Used to scale values to the range [0, 1].
            cutoff: Clip the range of pixel values for each band, by default None.
                Takes only pixel values from 0 to the value of the cutoff and scales them back to between 0 and 1.
                Should be a list with one value per band.
            percentile: The percentile value to be used for scaling the array values, by default None.
                Used to enhance contrast by stretching the histogram.
                If provided, this takes precedence over surface_reflectance.

        Returns:
            np.ndarray: The prepared array with shape (height, width, 3) suitable for RGB visualization.
                Values are normalized to the range [0, 1].
                the rgb 3d array is converted into 2d array to be plotted using the plt.imshow function.
                a float32 array normalized between 0 and 1 using the `percentile` values or the `surface_reflectance`.
                if the `percentile` or `surface_reflectance` values are not given, the function just reorders the values
                to have the red-green-blue order.

        Raises:
            ValueError: If the array shape is incompatible with the provided RGB indices.

        Notes:
            - The `prepare_array` function is called in the constructor of the `ArrayGlyph` class to prepare the array,
              so you can provide the same parameters of the `prepare_array` function to the `ArrayGlyph constructor`.
            - The prepare function moves the first axes (the channel axis) to the last axes, and then scales the array
              using the percentile values. If the percentile is not given, the function scales the array using the
              surface reflectance values. If the surface reflectance is not given, the function scales the array using
              the cutoff values. If the cutoff is not given, the function scales the array using the sentinel data

        Examples:
        Prepare an array using percentile-based scaling:
            ```python
            >>> import numpy as np
            >>> from cleopatra.glyphs.gridded.array_glyph import ArrayGlyph
            >>> # Create a 3-band array (e.g., satellite image)
            >>> bands = np.random.randint(0, 10000, size=(3, 100, 100))
            >>> glyph = ArrayGlyph(np.zeros((1, 1)))  # Dummy initialization
            >>> rgb_array = glyph.prepare_array(bands, rgb=[0, 1, 2], percentile=2)
            >>> rgb_array.shape
            (100, 100, 3)
            >>> np.all((0 <= rgb_array) & (rgb_array <= 1))
            np.True_

            ```
        Prepare an array using surface reflectance normalization:
            ```python
            >>> rgb_array = glyph.prepare_array(bands, rgb=[0, 1, 2], surface_reflectance=10000)
            >>> rgb_array.shape
            (100, 100, 3)
            >>> np.all((0 <= rgb_array) & (rgb_array <= 1))
            np.True_

            ```
        Prepare an array with cutoff values:
            ```python
            >>> rgb_array = glyph.prepare_array(
            ...     bands, rgb=[0, 1, 2], surface_reflectance=10000, cutoff=[0.3, 0.3, 0.3]
            ... )
            >>> rgb_array.shape
            (100, 100, 3)
            >>> np.all((0 <= rgb_array) & (rgb_array <= 1))
            np.True_

            ```

        - Create an array and instantiate the `ArrayGlyph` class.
            ```python
            >>> import numpy as np
            >>> arr = np.random.randint(0, 255, size=(3, 5, 5)).astype(np.float32)
            >>> array_glyph = ArrayGlyph(arr)
            >>> print(array_glyph.arr.shape)
            (3, 5, 5)

            ```
        `rgb` channels:
            - Now let's use the `prepare_array` function with `rgb` channels as [0, 1, 2]. so the finction does not to
                reorder the chennels. but it just needs to move the first axis to the last axis.
                ```python
                >>> rgb_array = array_glyph.prepare_array(arr, rgb=[0, 1, 2])
                >>> print(rgb_array.shape)
                (5, 5, 3)

                ```
            - If we compare the values of the first channel in the original array with the first array in the rgb array it
                should be the same.
                ```python
                >>> np.testing.assert_equal(arr[0, :, :],rgb_array[:, :, 0])

                ```
        surface_reflectance:
            - if you provide the surface reflectance value, the function will scale the array using the surface reflectance
                value to a normalized rgb values.
                ```python
                >>> array_glyph = ArrayGlyph(arr)
                >>> rgb_array = array_glyph.prepare_array(arr, surface_reflectance=10000, rgb=[0, 1, 2])
                >>> print(rgb_array.shape)
                (5, 5, 3)

                ```
            - if you print the values of the first channel, you will find all the values are between 0 and 1.
                ```python
                >>> print(rgb_array[:, :, 0]) # doctest: +SKIP
                [[0.0195 0.02   0.0109 0.0211 0.0087]
                 [0.0112 0.0221 0.0035 0.0234 0.0141]
                 [0.0116 0.0188 0.0001 0.0176 0.    ]
                 [0.0014 0.0147 0.0043 0.0167 0.0117]
                 [0.0083 0.0139 0.0186 0.02   0.0058]]

                ```
            - With the `surface_reflectance` parameter, you can also use the `cutoff` parameter to affect values that
                are above it, by rescaling them.
                ```python
                >>> rgb_array = array_glyph.prepare_array(
                ...     arr, surface_reflectance=10000, rgb=[0, 1, 2], cutoff=[0.8, 0.8, 0.8]
                ... )
                >>> print(rgb_array[:, :, 0]) # doctest: +SKIP
                [[0.     0.     0.     0.     0.    ]
                 [1.     1.     1.     1.     1.    ]
                 [1.     1.     1.     1.     1.    ]
                 [0.0014 0.0147 0.0043 0.0167 0.0117]
                 [0.0083 0.0139 0.0186 0.02   0.0058]]

                ```
        """
        return RgbBands(
            rgb,
            surface_reflectance=surface_reflectance,
            cutoff=cutoff,
            percentile=percentile,
        ).prepare(array)

    @staticmethod
    def scale_percentile(arr: np.ndarray, percentile: int = 1) -> np.ndarray:
        """Scale an array using percentile-based contrast stretching.

        This method enhances the contrast of an image by stretching the histogram
        based on percentile values. It calculates the lower and upper percentile values
        for each band and normalizes the data to the range [0, 1].

        Args:
            arr: The array to be scaled, with shape (height, width, bands).
                Typically an RGB image with 3 bands.
            percentile: The percentile value to be used for scaling, by default 1.
                This value determines how much of the histogram tails to exclude.
                Higher values result in more contrast stretching.
                Typical values range from 1 to 5.

        Returns:
            np.ndarray: The scaled array, normalized between 0 and 1, with the same shape as input.
                Data type is float32.

        Notes:
            The method works by:
            1. Computing the lower percentile value for each band
            2. Computing the upper percentile value (100 - percentile) for each band
            3. Normalizing each band using these percentile values
            4. Clipping values to the range [0, 1]

            This is particularly useful for visualizing satellite imagery with high dynamic range.

        Examples:
        Scale a single-band array:
        ```python
        >>> import numpy as np
        >>> from cleopatra.glyphs.gridded.array_glyph import ArrayGlyph
        >>> # Create a test array with values between 0 and 10000
        >>> test_array = np.random.randint(0, 10000, size=(100, 100, 1))
        >>> scaled = ArrayGlyph.scale_percentile(test_array, percentile=2)
        >>> scaled.shape
        (100, 100, 1)
        >>> np.all((0 <= scaled) & (scaled <= 1))
        np.True_

        ```
        Scale an RGB array:
        ```python
        >>> rgb_array = np.random.randint(0, 10000, size=(100, 100, 3))
        >>> scaled = ArrayGlyph.scale_percentile(rgb_array, percentile=2)
        >>> scaled.shape
        (100, 100, 3)
        >>> np.all((0 <= scaled) & (scaled <= 1))
        np.True_

        ```
        Using different percentile values affects contrast:
        ```python
        >>> low_contrast = ArrayGlyph.scale_percentile(rgb_array, percentile=1)
        >>> high_contrast = ArrayGlyph.scale_percentile(rgb_array, percentile=5)
        >>> # Higher percentile typically results in higher contrast

        ```
        """
        rows, columns, bands = arr.shape
        arr = np.reshape(arr, [rows * columns, bands]).astype(np.float32)
        lower_percent = np.percentile(arr, percentile, axis=0)
        upper_percent = np.percentile(arr, 100 - percentile, axis=0) - lower_percent
        arr = (arr - lower_percent[None, :]) / upper_percent[None, :]
        arr = np.reshape(arr, [rows, columns, bands])
        arr = arr.clip(0, 1)

        return arr

    def __str__(self):
        """String representation of the Array object."""
        message = f"""
                    Min: {self.vmin}
                    Max: {self.vmax}
                    Exclude values: {self.exclude_value}
                    RGB: {self.rgb}
                """
        return message

    @property
    def exclude_value(self):
        """Value(s) treated as nodata and masked out of the array.

        Cells equal to `exclude_value` are masked so they are excluded
        from the colour range and rendered as gaps. Defaults to `nan`.

        Returns:
            The excluded value, or a list of excluded values.

        Examples:
            - With no explicit nodata, NaN is excluded by default:
                ```python
                >>> import math
                >>> import numpy as np
                >>> from cleopatra.glyphs.gridded.array_glyph import ArrayGlyph
                >>> glyph = ArrayGlyph(np.array([[1.0, 2.0], [3.0, 4.0]]))
                >>> math.isnan(glyph.exclude_value)
                True

                ```
            - Excluding a sentinel masks the matching cells:
                ```python
                >>> import numpy as np
                >>> from cleopatra.glyphs.gridded.array_glyph import ArrayGlyph
                >>> arr = np.array([[1.0, 2.0], [3.0, -9.0]])
                >>> glyph = ArrayGlyph(arr, exclude_value=[-9.0])
                >>> glyph.exclude_value
                [-9.0]
                >>> int(glyph.arr.mask.sum())
                1

                ```
        """
        return self._exclude_value

    @exclude_value.setter
    def exclude_value(self, value):
        """Set the excluded nodata value(s).

        Args:
            value: The value (or list of values) to mask out (see the
                `exclude_value` property).
        """
        self._exclude_value = value

    def _auto_figsize(self) -> tuple[float, float]:
        """A figure size whose aspect matches the data, for a filled map.

        `ArrayGlyph` draws with equal aspect (undistorted geography), so a wide
        or tall field in the default square figure collapses to a thin strip with
        an oversized-looking colorbar. When the caller did not pass an explicit
        `figsize`, this derives one from the data's own aspect ratio -- from
        `extent` (matplotlib order `[xmin, xmax, ymin, ymax]`), else the `coords`
        ranges, else the array's pixel shape -- so the map fills the figure. Any
        degenerate input falls back to the configured default `figsize`.

        Returns:
            tuple[float, float]: `(width, height)` in inches.
        """
        default = tuple(self.default_options["figsize"])
        if self.default_options.get("projection") == "globe":
            return (
                7.5,
                6.5,
            )  # the orthographic disc is ~square, not the lon/lat aspect
        try:
            if self.extent is not None:
                xmin, xmax, ymin, ymax = (float(v) for v in self.extent)
                width, height = abs(xmax - xmin), abs(ymax - ymin)
            elif self._coords is not None:
                xs, ys = self._coords
                width = abs(float(np.nanmax(xs)) - float(np.nanmin(xs)))
                height = abs(float(np.nanmax(ys)) - float(np.nanmin(ys)))
            else:
                arr = np.asarray(self.arr)
                if arr.ndim == 2 or (arr.ndim == 3 and arr.shape[-1] in (3, 4)):
                    height, width = float(arr.shape[0]), float(arr.shape[1])
                else:
                    return default
        except (TypeError, ValueError, IndexError, AttributeError):
            return default
        if not (width > 0 and height > 0):
            return default
        aspect = width / height
        plot_height = 6.0  # target plot height (inches)
        cbar_pad = 1.8  # room for the colorbar + its labels
        max_width = 14.0
        fig_w = plot_height * aspect + cbar_pad
        fig_h = plot_height
        if (
            fig_w > max_width
        ):  # very wide field: cap width, shrink height to keep the aspect
            fig_w = max_width
            fig_h = max(3.5, (max_width - cbar_pad) / aspect)
        fig_w = max(5.0, fig_w)
        return (round(fig_w, 1), round(fig_h, 1))

    def create_figure_axes(self) -> tuple[Figure, Axes]:
        """Create the figure/axes, sizing the figure to the data when needed.

        Overrides `Glyph.create_figure_axes` to use `_auto_figsize` whenever the
        caller left `figsize` at its default (did not pass it explicitly), so an
        equal-aspect map fills the figure instead of collapsing into a strip. An
        explicit `figsize=` is always honoured unchanged.

        Returns:
            tuple[matplotlib.figure.Figure, matplotlib.axes.Axes]: The new figure
            and axes.
        """
        figsize = self.default_options["figsize"]
        auto = "figsize" not in getattr(self, "_explicit_options", set())
        if auto:
            figsize = self._auto_figsize()
        fig, ax = plt.subplots(figsize=figsize)
        self._owns_figure = True
        self._auto_figure = auto
        return fig, ax

    def _tighten_figure(self, pad_inches: float = 0.02) -> None:
        """Shrink the figure to its drawn content, in place.

        `ArrayGlyph` draws with equal aspect, so the figure holding it is almost
        always larger than the map + colorbar + title, leaving a margin. Jupyter's
        inline backend hides that margin because it saves with
        `bbox_inches="tight"`, but a plain `savefig` -- or an animation writer,
        which does not crop -- keeps it, so a saved figure or GIF looks loose
        while the inline preview looked tight.

        This closes that gap at the *figure* level rather than per save call:
        measure the rendered content once, translate every axes rigidly so the
        content's lower-left sits at the origin, and resize the figure to match.
        Because the figure itself becomes tight, every export path -- a bare
        `savefig`, `embed_gif`, `to_gif`, a raw `PillowWriter` -- is tight and
        identical. The whole axes group moves together, so the relative layout
        (map, colorbar gap, title) is preserved; only the outer margin is
        removed. A small uniform `pad_inches` is kept so edge ticks/labels are
        not shaved.

        Args:
            pad_inches: Uniform margin left around the content, in inches.
        """
        fig = self.fig
        if fig is None or not fig.axes:
            return
        try:
            fig.canvas.draw()
            content = fig.get_tightbbox(fig.canvas.get_renderer())
        except Exception:  # noqa: BLE001 -- tightening is cosmetic and fully optional
            return
        if content is None:
            return
        fig_w, fig_h = (float(v) for v in fig.get_size_inches())
        new_w = (content.x1 - content.x0) + 2 * pad_inches
        new_h = (content.y1 - content.y0) + 2 * pad_inches
        if not (new_w > 0 and new_h > 0):
            return
        for axes in fig.axes:
            pos = axes.get_position()
            axes.set_position(
                [
                    (pos.x0 * fig_w - content.x0 + pad_inches) / new_w,
                    (pos.y0 * fig_h - content.y0 + pad_inches) / new_h,
                    (pos.width * fig_w) / new_w,
                    (pos.height * fig_h) / new_h,
                ]
            )
        fig.set_size_inches(new_w, new_h)

    @staticmethod
    def _validate_coords(
        coords: tuple[np.ndarray, np.ndarray] | list[np.ndarray] | None,
        array: np.ndarray,
    ) -> tuple[np.ndarray, np.ndarray] | None:
        """Validate the `coords` kwarg and return a normalised `(x, y)` tuple.

        Args:
            coords: User-provided coordinates. `None` (no curvilinear
                support), or a length-2 tuple/list of arrays. Each
                element is either 1-D (length matches the last axis of
                `array` for `x` and the second-to-last for `y`)
                or 2-D with shape `array.shape[-2:]`.
            array: The data array used to validate coordinate shapes.

        Returns:
            tuple[np.ndarray, np.ndarray] or None: The validated
                `(x, y)` pair, with each element cast to `np.ndarray`.

        Raises:
            TypeError: If `coords` is not `None` and not a length-2
                sequence.
            ValueError: If a coordinate array has a shape that does not
                match the data array, or a non-numeric dtype (bool,
                complex, object, …).

        Examples:
            - `None` short-circuits to `None`:
                ```python
                >>> import numpy as np
                >>> from cleopatra.glyphs.gridded.array_glyph import ArrayGlyph
                >>> ArrayGlyph._validate_coords(None, np.zeros((3, 4))) is None
                True

                ```
            - 1-D centres matching `array.shape[-1]` (x) and
                `array.shape[-2]` (y) are accepted:
                ```python
                >>> import numpy as np
                >>> from cleopatra.glyphs.gridded.array_glyph import ArrayGlyph
                >>> arr = np.zeros((3, 4))
                >>> x = np.array([0.0, 1.0, 2.0, 3.0])
                >>> y = np.array([0.0, 1.0, 2.0])
                >>> xs, ys = ArrayGlyph._validate_coords((x, y), arr)
                >>> xs.shape, ys.shape
                ((4,), (3,))

                ```
            - A non-tuple raises `TypeError`:
                ```python
                >>> import numpy as np
                >>> from cleopatra.glyphs.gridded.array_glyph import ArrayGlyph
                >>> ArrayGlyph._validate_coords("oops", np.zeros((3, 4)))
                Traceback (most recent call last):
                    ...
                TypeError: `coords` must be a length-2 sequence of arrays (x, y), got str.

                ```
        """
        if coords is None:
            result = None
        else:
            if not isinstance(coords, (tuple, list)) or len(coords) != 2:
                raise TypeError(
                    "`coords` must be a length-2 sequence of arrays "
                    f"(x, y), got {type(coords).__name__}."
                )
            x_in, y_in = coords
            x_arr = np.asarray(x_in)
            y_arr = np.asarray(y_in)
            for name, arr_ in (("x", x_arr), ("y", y_arr)):
                if not (
                    np.issubdtype(arr_.dtype, np.integer)
                    or np.issubdtype(arr_.dtype, np.floating)
                ):
                    raise ValueError(
                        f"{name}: {_COORD_DTYPE_MISMATCH}; got dtype {arr_.dtype}."
                    )
            data_shape = array.shape[-2:]
            rows, cols = data_shape
            x_ok = (x_arr.ndim == 1 and x_arr.shape[0] == cols) or (
                x_arr.ndim == 2 and x_arr.shape == data_shape
            )
            y_ok = (y_arr.ndim == 1 and y_arr.shape[0] == rows) or (
                y_arr.ndim == 2 and y_arr.shape == data_shape
            )
            if not x_ok:
                raise ValueError(
                    f"x {_COORD_SHAPE_MISMATCH}: got shape {x_arr.shape}, "
                    f"expected 1-D length {cols} or 2-D {data_shape}."
                )
            if not y_ok:
                raise ValueError(
                    f"y {_COORD_SHAPE_MISMATCH}: got shape {y_arr.shape}, "
                    f"expected 1-D length {rows} or 2-D {data_shape}."
                )
            result = (x_arr, y_arr)
        return result

    @property
    def coords(self) -> tuple[np.ndarray, np.ndarray] | None:
        """Optional `(x, y)` coordinate arrays for curvilinear grids.

        Returns the validated coordinate pair stored at construction
        time, or `None` when the glyph was built without `coords`
        (regular pixel-grid render). When non-`None`, `plot(kind="auto")`
        routes to `pcolormesh` so the (x, y) arrays are honoured.

        Returns:
            tuple[np.ndarray, np.ndarray] or None: The `(x, y)` pair
                as stored on the instance (each cast to
                `numpy.ndarray`), or `None`.

        Examples:
            - A glyph built without `coords` reports `None`:
                ```python
                >>> import numpy as np
                >>> from cleopatra.glyphs.gridded.array_glyph import ArrayGlyph
                >>> glyph = ArrayGlyph(np.zeros((3, 4)))
                >>> glyph.coords is None
                True

                ```
            - A glyph built with 1-D centres exposes the validated
                arrays back through the property:
                ```python
                >>> import numpy as np
                >>> from cleopatra.glyphs.gridded.array_glyph import ArrayGlyph
                >>> arr = np.zeros((3, 4))
                >>> x = np.linspace(0.0, 3.0, 4)
                >>> y = np.linspace(0.0, 2.0, 3)
                >>> glyph = ArrayGlyph(arr, coords=(x, y))
                >>> xs, ys = glyph.coords
                >>> xs.shape, ys.shape
                ((4,), (3,))
                >>> float(xs[-1]), float(ys[-1])
                (3.0, 2.0)

                ```
        """
        return self._coords

    @staticmethod
    def _validate_extend(extend: str | None) -> None:
        """Validate the `extend` kwarg against the allowed values.

        Args:
            extend: User-provided value for the colorbar extension. May
                be `None` (auto-resolve at render time) or one of
                `"neither"`, `"both"`, `"min"`, `"max"`.

        Raises:
            ValueError: When `extend` is not one of the accepted
                strings (or `None`).

        Examples:
            - Accepted values return `None` silently:
                ```python
                >>> from cleopatra.glyphs.gridded.array_glyph import ArrayGlyph
                >>> ArrayGlyph._validate_extend("both") is None
                True
                >>> ArrayGlyph._validate_extend(None) is None
                True

                ```
            - Unsupported values raise `ValueError`:
                ```python
                >>> from cleopatra.glyphs.gridded.array_glyph import ArrayGlyph
                >>> ArrayGlyph._validate_extend("up")
                Traceback (most recent call last):
                    ...
                ValueError: Invalid extend='up'. Valid values are ('neither', 'both', 'min', 'max') or None.

                ```
        """
        if extend is None:
            return
        if extend not in VALID_EXTEND_VALUES:
            raise ValueError(
                f"Invalid extend={extend!r}. Valid values are "
                f"{VALID_EXTEND_VALUES} or None."
            )

    @staticmethod
    def _robust_limits(arr: np.ndarray) -> tuple[float, float]:
        """Compute xarray-style robust `(vmin, vmax)` from the data.

        Returns the 2nd and 98th percentile of the unmasked, finite
        values in `arr` — the same convention as xarray's
        `robust=True`. Masked entries and NaNs are excluded from the
        percentile computation.

        Args:
            arr: Input array. May be a plain ndarray or a masked array.

        Returns:
            tuple[float, float]: `(vmin_robust, vmax_robust)`.

        Raises:
            ValueError: If the array contains no finite values.

        Examples:
            - Outliers are clipped to the 2nd/98th percentile:
                ```python
                >>> import numpy as np
                >>> from cleopatra.glyphs.gridded.array_glyph import ArrayGlyph
                >>> arr = np.arange(100, dtype=float)
                >>> arr[0] = -1e6  # extreme low outlier
                >>> arr[-1] = 1e6  # extreme high outlier
                >>> vmin, vmax = ArrayGlyph._robust_limits(arr)
                >>> round(vmin, 1), round(vmax, 1)
                (2.0, 97.0)

                ```
            - Masked and NaN entries are excluded from the percentile
                computation:
                ```python
                >>> import numpy as np
                >>> import numpy.ma as ma
                >>> from cleopatra.glyphs.gridded.array_glyph import ArrayGlyph
                >>> raw = np.array([np.nan, 0.0, 1.0, 2.0, 3.0, 4.0])
                >>> arr = ma.array(raw, mask=[True, False, False, False, False, False])
                >>> vmin, vmax = ArrayGlyph._robust_limits(arr)
                >>> round(vmin, 2), round(vmax, 2)
                (0.08, 3.92)

                ```
        """
        if isinstance(arr, ma.MaskedArray):
            values = arr.compressed()
        else:
            values = np.asarray(arr).ravel()
        values = values[np.isfinite(values)]
        if values.size == 0:
            raise ValueError(
                "Cannot compute robust vmin/vmax: array has no finite values."
            )
        vmin_robust = float(np.nanpercentile(values, ROBUST_LOWER_PERCENTILE))
        vmax_robust = float(np.nanpercentile(values, ROBUST_UPPER_PERCENTILE))
        return vmin_robust, vmax_robust

    @staticmethod
    def _log_safe_vmin(arr: np.ndarray) -> float | None:
        """A positive lower bound for a log colour scale that drops low outliers.

        A `LogNorm` has no linear band, so a single near-zero pixel drags the
        whole scale down: the bar then spans decades far below the data's bulk
        and the map's real values collapse into the top slice of colours. Unlike
        the norm-building code -- which only sees `vmin`/`vmax` -- this has the
        data, so it can tell a stray low outlier from genuinely low data.

        A value counts as an extreme low outlier when it sits more than
        `LOG_OUTLIER_DECADES` decades below the `ROBUST_LOWER_PERCENTILE`-th
        percentile of the positive values. The floor is the smallest value that
        is *not* an outlier: a stray near-zero pixel is dropped, but data whose
        low end is genuine (its minimum is within those decades) keeps its true
        minimum, so nothing is clipped needlessly.

        This targets a *small fraction* of stray low pixels. Once the low
        outliers make up more than about `ROBUST_LOWER_PERCENTILE`% of the
        positive values, the reference percentile itself sinks into them and the
        floor no longer fires -- for a field with many unmasked near-zero /
        no-data pixels, mask them or pass an explicit `vmin` instead.

        Args:
            arr: The layer's data array (may be masked).

        Genuine negative data is left for `build_log_norm` to reject: the floor
        returns `None` so `vmin` stays negative and the norm raises, steering the
        caller to `sym_log()` rather than silently masking the negatives. A lone
        exact zero among positives is not negative, so it is still rescued.

        Returns:
            float or None: The outlier-safe positive lower bound, or `None` when
                the array has no positive finite values, or when it contains a
                genuine negative value (the log norm then raises on its own,
                reporting the real non-positive range).

        Examples:
            - A lone near-zero pixel is dropped; the real minimum sets the floor:
                ```python
                >>> import numpy as np
                >>> from cleopatra.glyphs.gridded.array_glyph import ArrayGlyph
                >>> arr = np.concatenate(([1e-4], np.arange(1, 745.0)))
                >>> round(ArrayGlyph._log_safe_vmin(arr))
                1

                ```
        """
        if isinstance(arr, ma.MaskedArray):
            values = arr.compressed()
        else:
            values = np.asarray(arr).ravel()
        finite = values[np.isfinite(values)]
        if np.any(finite < 0.0):
            return None
        positive = finite[finite > 0.0]
        if positive.size == 0:
            return None
        robust_low = float(np.nanpercentile(positive, ROBUST_LOWER_PERCENTILE))
        cutoff = robust_low / 10.0**LOG_OUTLIER_DECADES
        # `non_outliers` always contains the maximum (>= robust_low > cutoff), so
        # it is non-empty whenever `positive` is.
        non_outliers = positive[positive >= cutoff]
        return float(non_outliers.min())

    def _log_floored_vmin(
        self,
        arr: np.ndarray,
        vmin: float,
        vmin_pinned: bool,
        ticks_spacing_pinned: bool,
    ) -> float:
        """Return `vmin` raised to an outlier-safe positive floor for a log scale.

        Returns `vmin` unchanged unless the resolved colour scale is `lognorm`
        and the caller did not pin `vmin`. Otherwise the floor from
        `_log_safe_vmin` replaces `vmin` when it is higher (never lower), so a
        near-zero outlier stops dragging the log bar's decades below the data's
        bulk (issue #339); the true `vmax` is untouched and this render's tick
        spacing is refreshed unless the caller pinned it.

        This is a per-render adjustment: it does **not** mutate the glyph's
        persistent `self._vmin`, so reusing the same glyph for a later non-log
        render still auto-ranges from the true data minimum rather than
        inheriting the floor.

        Scope: applied on this glyph's `plot()` and `animate()` paths only. Other
        glyphs, and the data-style `norm='log'` preset path (which does not set
        `color_scale='lognorm'`), do not use this floor.

        Args:
            arr: The layer's data array (may be masked).
            vmin: This render's current lower colour limit.
            vmin_pinned: Whether the caller set `vmin` explicitly (it then wins).
            ticks_spacing_pinned: Whether the caller set `ticks_spacing`
                explicitly (it is then left as-is).

        Returns:
            float: The floored lower limit for this render, or `vmin` unchanged.
        """
        if vmin_pinned:
            return vmin
        if self.default_options.get("color_scale", "").lower() != "lognorm":
            return vmin
        log_floor = self._log_safe_vmin(arr)
        if log_floor is None or log_floor <= vmin:
            return vmin
        if not ticks_spacing_pinned:
            self.default_options["ticks_spacing"] = (self._vmax - log_floor) / 10 or 1.0
        return log_floor

    @staticmethod
    def _center_limits(vmin: float, vmax: float, center: float) -> tuple[float, float]:
        """Make `(vmin, vmax)` symmetric around `center`.

        Implements xarray's diverging-cmap centring: the larger of
        `|vmin - center|` and `|vmax - center|` becomes the half-
        range, and the result is `(center - half, center + half)`.

        Args:
            vmin: Lower colour limit before symmetrisation.
            vmax: Upper colour limit before symmetrisation.
            center: Value to centre the diverging colormap on.

        Returns:
            tuple[float, float]: Symmetric `(vmin, vmax)` around
                `center`.

        Examples:
            - Centring around zero expands the smaller side to match
                the larger one:
                ```python
                >>> from cleopatra.glyphs.gridded.array_glyph import ArrayGlyph
                >>> ArrayGlyph._center_limits(-3.0, 8.0, 0.0)
                (-8.0, 8.0)

                ```
            - Centring around a non-zero value (e.g. an anomaly base
                of 5.0):
                ```python
                >>> from cleopatra.glyphs.gridded.array_glyph import ArrayGlyph
                >>> low, high = ArrayGlyph._center_limits(2.0, 12.0, 5.0)
                >>> low, high
                (-2.0, 12.0)
                >>> (low + high) / 2  # centred on 5.0
                5.0

                ```
        """
        half = max(abs(vmin - center), abs(vmax - center))
        return center - half, center + half

    def _resolve_color_limits(
        self,
        arr: np.ndarray,
        vmin_kw: float | None,
        vmax_kw: float | None,
        robust: bool,
        center: float | None,
        vmin_explicit: bool,
        vmax_explicit: bool,
    ) -> tuple[float, float]:
        """Resolve final `(vmin, vmax)` for colour scaling.

        Resolution order matches xarray:

        1. Start from robust (2nd/98th percentile) limits when
           `robust=True`, else from the full data range.
        2. Override either end with an explicit `vmin` / `vmax` if
           the user provided one.
        3. If `center` is set, symmetrise around it.

        Args:
            arr: Data array (plain or masked).
            vmin_kw: Value of `vmin` from the caller's kwargs, or
                `None` if not supplied.
            vmax_kw: Value of `vmax` from the caller's kwargs, or
                `None` if not supplied.
            robust: Whether to use the 2nd/98th percentile range.
            center: Value to centre a diverging colormap on. `None`
                disables symmetrisation.
            vmin_explicit: Whether the caller explicitly passed
                `vmin` (even if its value was `None`).
            vmax_explicit: Whether the caller explicitly passed
                `vmax`.

        Returns:
            tuple[float, float]: Final `(vmin, vmax)`.

        Raises:
            ValueError: If the resolved limits are not finite — e.g. the
                array has no finite values (all NaN / fully masked) and no
                explicit `vmin` / `vmax` was supplied to fall back on.

        Examples:
            - Default path: full data range, no robust clipping, no
                centring:
                ```python
                >>> import numpy as np
                >>> from cleopatra.glyphs.gridded.array_glyph import ArrayGlyph
                >>> data = np.arange(25, dtype=float).reshape(5, 5)
                >>> glyph = ArrayGlyph(data)
                >>> glyph._resolve_color_limits(
                ...     data,
                ...     vmin_kw=None,
                ...     vmax_kw=None,
                ...     robust=False,
                ...     center=None,
                ...     vmin_explicit=False,
                ...     vmax_explicit=False,
                ... )
                (0.0, 24.0)

                ```
            - Explicit `vmax` overrides the data-driven upper limit
                and `center` then symmetrises around the centre:
                ```python
                >>> import numpy as np
                >>> from cleopatra.glyphs.gridded.array_glyph import ArrayGlyph
                >>> data = np.arange(25, dtype=float).reshape(5, 5)
                >>> glyph = ArrayGlyph(data)
                >>> glyph._resolve_color_limits(
                ...     data,
                ...     vmin_kw=None,
                ...     vmax_kw=10.0,
                ...     robust=False,
                ...     center=0.0,
                ...     vmin_explicit=False,
                ...     vmax_explicit=True,
                ... )
                (-10.0, 10.0)

                ```
        """
        if robust:
            vmin_base, vmax_base = self._robust_limits(arr)
        else:
            with warnings.catch_warnings():
                warnings.simplefilter("ignore", RuntimeWarning)
                vmin_base = np.nanmin(arr)
                vmax_base = np.nanmax(arr)

        vmin_final = vmin_kw if vmin_explicit and vmin_kw is not None else vmin_base
        vmax_final = vmax_kw if vmax_explicit and vmax_kw is not None else vmax_base

        if not (np.isfinite(vmin_final) and np.isfinite(vmax_final)):
            raise ValueError(
                "Cannot determine vmin/vmax: the array has no finite "
                "values. Pass explicit vmin and vmax, or filter the array "
                "first."
            )

        if center is not None:
            vmin_final, vmax_final = self._center_limits(vmin_final, vmax_final, center)

        return float(vmin_final), float(vmax_final)

    def _norm_cbar_and_ticks(
        self, ticks: np.ndarray
    ) -> tuple[Normalize | None, dict, np.ndarray]:
        """Resolve the `(norm, cbar_kw, ticks)` triple for the raster render.

        The single bridge `ArrayGlyph`'s render sites use instead of calling
        `_create_norm_and_cbar_kw` directly, so classification is honoured on
        the one glyph that draws a 2-D field. When the `scheme` option is unset
        (the default) it is the plain continuous path and the incoming `ticks`
        pass straight through. When `scheme` is set, the array's finite cells
        (`_scale_values`, which flattens the whole stored stack so a facet /
        animation shares one set of classes) are binned by
        `Glyph._prepare_classified_mapping` into a `matplotlib.colors.BoundaryNorm`,
        and the returned `ticks` become the class edges (so `vmin`/`vmax` derived
        from them span the classified range and the colorbar steps on the
        boundaries). `scheme="categorical"` is rejected here — an `ArrayGlyph`'s
        cells are a continuous field, not nominal labels — via the shared
        `_prepare_categorical_mapping` guard.

        Args:
            ticks: The continuous colorbar ticks from `get_ticks()`; used as-is
                when no `scheme` is set, ignored (replaced by the class edges)
                when one is.

        Returns:
            tuple[Normalize or None, dict, np.ndarray]: the matplotlib norm
                (`None` for a plain linear scale, a `BoundaryNorm` when
                classified), the colorbar keyword arguments, and the ticks the
                render should use (the class edges when classified).

        Raises:
            ValueError: If `scheme="categorical"` (unsupported for a raster), or
                propagated from `classify` for an unknown scheme / degenerate
                data.
        """
        scheme = self.default_options.get("scheme")
        if scheme is None:
            norm, cbar_kw = self._create_norm_and_cbar_kw(ticks)
            return norm, cbar_kw, ticks
        if scheme == "categorical":
            return self._prepare_categorical_mapping(self._scale_values())
        return self._prepare_classified_mapping(self._scale_values(), scheme)

    def _plot_im_get_cbar_kw(
        self,
        ax: Axes,
        arr: np.ndarray,
        norm: Normalize | None,
        cbar_kw: dict,
        ticks: np.ndarray,
        kind: str = "imshow",
    ) -> tuple[Any, dict[str, str]]:
        """Render the array on `ax` and return the artist plus cbar kwargs.

        Takes the `(norm, cbar_kw, ticks)` triple already resolved by
        `_norm_cbar_and_ticks` (once per `plot` / `animate`, so classification
        and its conflict warning happen a single time) and dispatches to the
        requested `kind` of plot. All four kinds share that norm, so the
        `color_scale` enum (linear/power/sym-lognorm/lognorm/boundary-norm/
        midpoint/equalize) and the classified `BoundaryNorm` work identically
        for every render kind.

        When `self._coords` is set (curvilinear / non-uniform grid),
        the `(x, y)` arrays are forwarded as the first positional
        args to `pcolormesh` / `contour` / `contourf`. `kind="imshow"`
        is incompatible with `coords` and raises `ValueError` — callers
        should use `kind="auto"` or `kind="pcolormesh"` instead.

        Args:
            ax: matplotlib figure axes.
            arr: numpy (masked) array.
            norm: The resolved matplotlib norm (`None` for a plain linear
                scale, a `BoundaryNorm` when a scheme is set).
            cbar_kw: The resolved colorbar keyword-argument dict.
            ticks: The resolved colorbar ticks (the class edges when a scheme
                is set); `ticks[0]`/`ticks[-1]` drive `vmin`/`vmax`.
            kind: render kind. One of `"imshow"`, `"pcolormesh"`,
                `"contour"`, `"contourf"`. Default is `"imshow"`
                (preserves the historical animate/legacy call path).

        Returns:
            tuple: `(artist, cbar_kw)` where `artist` is the
                matplotlib mappable (`AxesImage` for `imshow`,
                `QuadMesh` for `pcolormesh`, `QuadContourSet` for
                contour/contourf) and `cbar_kw` is the colorbar
                keyword-argument dict.

        Raises:
            ValueError: If `kind` is `"imshow"` while `self._coords`
                is set (incompatible combination), or if `kind` is not
                one of the recognised values in `VALID_PLOT_KINDS`.
        """
        cmap = resolve_colormap(self.default_options["cmap"])
        vmin = ticks[0]
        vmax = ticks[-1]

        self.contour_labels = None

        plot_arr = arr
        if (
            self.default_options.get("norm") is None
            and self.default_options["color_scale"].lower() == "midpoint"
        ):
            plot_arr = ma.filled(arr, np.nan)

        levels = self.default_options.get("levels")

        coords = self._coords

        # Hatch fields are contourf-only; warn once here (kind is already the
        # resolved effective kind) so imshow/pcolormesh/contour -- and animate,
        # which renders through this helper as imshow -- all report ignored
        # hatch fields, not only kind="contour".
        if kind != "contourf" and (
            self.default_options.get("hatches") is not None
            or self.default_options.get("hatch_color") is not None
            or self.default_options.get("fill") is not None
        ):
            warnings.warn(
                "hatches/fill/hatch_color are contourf-only and are ignored "
                f"for kind={kind!r}.",
                stacklevel=3,
            )

        im: Any
        if kind == "imshow":
            if coords is not None:
                raise ValueError("`coords` requires kind='pcolormesh' or 'auto'.")
            if norm is None:
                im = ax.matshow(
                    plot_arr, cmap=cmap, vmin=vmin, vmax=vmax, extent=self.extent
                )
            else:
                im = ax.matshow(plot_arr, cmap=cmap, norm=norm, extent=self.extent)
        elif kind == "pcolormesh":
            pcm_args = (
                (coords[0], coords[1], plot_arr) if coords is not None else (plot_arr,)
            )
            if norm is None:
                im = ax.pcolormesh(
                    *pcm_args,
                    cmap=cmap,
                    vmin=vmin,
                    vmax=vmax,
                    shading="auto",
                )
            else:
                im = ax.pcolormesh(*pcm_args, cmap=cmap, norm=norm, shading="auto")
        elif kind in ("contour", "contourf"):
            if isinstance(plot_arr, ma.MaskedArray):
                plot_arr = plot_arr.filled(np.nan)
            plot_fn = ax.contour if kind == "contour" else ax.contourf
            is_contourf = kind == "contourf"
            hatches = self.default_options.get("hatches")
            hatch_color = self.default_options.get("hatch_color")
            fill = self.default_options.get("fill")
            if is_contourf and hatches is None:
                if fill is False:
                    warnings.warn(
                        "fill=False with no hatches draws an invisible contour "
                        "set; pass hatches=[...] to draw the overlay.",
                        stacklevel=3,
                    )
                if hatch_color is not None:
                    warnings.warn(
                        "hatch_color has no effect without hatches.",
                        stacklevel=3,
                    )
            contour_kwargs: dict[str, Any]
            if is_contourf and fill is False:
                # Unfilled overlay: only the hatch marks draw. matplotlib rejects
                # cmap and colors together, and an unfilled set is not
                # colour-mapped, so vmin/vmax/norm are dropped with the cmap.
                if self.default_options.get("scheme") is not None:
                    warnings.warn(
                        "fill=False draws an unfilled (hatch-only) overlay with no "
                        "colour, so 'classify' only sets the band edges here -- its "
                        "class colours are not drawn; drop fill=False to fill the "
                        "classes.",
                        stacklevel=3,
                    )
                contour_kwargs = {"colors": "none"}
            else:
                contour_kwargs = {"cmap": cmap}
                if norm is None:
                    contour_kwargs["vmin"] = vmin
                    contour_kwargs["vmax"] = vmax
                else:
                    contour_kwargs["norm"] = norm
            if is_contourf and hatches is not None:
                contour_kwargs["hatches"] = hatches
            level_edges = self._levels_to_bounds(levels, vmin, vmax)
            if self.default_options.get("scheme") is not None:
                # Classification owns the discretisation: draw the isolines /
                # filled bands at the class edges (`ticks`), not any `levels`.
                level_edges = np.asarray(ticks)
            base_args = (
                (coords[0], coords[1], plot_arr) if coords is not None else (plot_arr,)
            )
            if level_edges is not None:
                im = plot_fn(*base_args, level_edges, **contour_kwargs)
            else:
                im = plot_fn(*base_args, **contour_kwargs)
            if is_contourf and hatch_color is not None:
                # Per-set hatch-stroke colour, independent of the global
                # hatch.color rcParam and without recolouring the band edges
                # (matplotlib >= 3.11).
                im.set_hatchcolor(hatch_color)
            if kind == "contour" and self.default_options.get("labels"):
                label_kw = {
                    "inline": True,
                    "fontsize": 8,
                    "fmt": "%g",
                    **(self.default_options.get("label_kw") or {}),
                }
                self.contour_labels = ax.clabel(im, **label_kw)
        else:
            raise ValueError(
                f"Invalid kind={kind!r}. Valid kinds are {VALID_PLOT_KINDS}."
            )

        hillshade = resolve_hillshade(self.default_options.get("hillshade"))
        if hillshade is not None:
            if kind == "imshow":
                hs_norm = norm if norm is not None else Normalize(vmin=vmin, vmax=vmax)
                elevation = np.asarray(
                    ma.filled(ma.asarray(plot_arr).astype(float), np.nan), dtype=float
                )
                im.set_data(shade_grid(elevation, cmap, norm=hs_norm, **hillshade))
            else:
                warnings.warn(
                    f"hillshade is only applied to kind='imshow'; ignored for "
                    f"kind={kind!r}.",
                    stacklevel=2,
                )

        return im, cbar_kw

    @property
    def style(self) -> str | None:
        """Name of the `DATA_STYLES` preset currently applied, or `None`.

        Reads back the preset set via the `style` constructor kwarg, a
        `plot(style=...)` call, or `apply_style`.
        """
        return self.default_options.get("style")

    def apply_style(self, style: str, **kwargs: Any) -> tuple[Figure, Axes]:
        """Apply a `DATA_STYLES` preset by name, re-rendering the glyph in place.

        A discoverable wrapper over `plot(style=...)` for restyling an
        already-built glyph. It redraws **in place** on the glyph's own axes
        (clearing the previous render first), so `apply_style` takes full
        ownership of that axes -- do not use it on an axes shared with unrelated
        caller content. If the glyph was never plotted (or its figure was
        closed), it renders on a fresh figure. Extra keyword arguments (e.g.
        `hillshade`, `add_colorbar`) are forwarded to `plot`. The applied style
        is **sticky** (survives a later plain `plot()`); `plot(style=None)`
        clears it. Per-call render overrides are sticky the same way: the
        colour-scale keywords (`vmin`/`vmax`/`center`/`cmap`/`extend`) and the
        `contour=`/`data_style=` group fields (`levels`/`bands`/`alpha`/
        `alpha_range`) captured on one call persist into later `plot`/`animate`
        calls on the same glyph until changed or cleared (pass the field as
        `None`) -- so an override set for one render (e.g. a
        `contour=Contour(levels=...)`) can carry into a later styled render on
        the same reused glyph.

        Args:
            style: A `cleopatra.styling.colors.DATA_STYLES` preset name (see
                `sorted(cleopatra.styling.colors.DATA_STYLES)`).
            **kwargs: Forwarded to `plot` (e.g. `hillshade`). `compose=True` is
                the one keyword `plot` accepts that this method cannot: it
                clears the axes before redrawing, so composing onto what is
                already there is a contradiction and is rejected rather than
                silently dropped.

        Returns:
            tuple[Figure, Axes]: The figure and axes drawn on.

        Raises:
            ValueError: If `style` is unknown or names a multi-layer preset
                (raised by `plot`), or if `compose=True` is passed -- with a
                message pointing at the `plot(data_style=DataStyle(style=...),
                ax=..., compose=True)` call that does draw a styled layer over
                an existing axes.

        Examples:
            - Restyle a rendered glyph by name:
                ```python
                >>> import matplotlib
                >>> matplotlib.use("Agg")
                >>> import numpy as np
                >>> from cleopatra.glyphs.gridded.array_glyph import ArrayGlyph
                >>> glyph = ArrayGlyph(np.arange(60.0).reshape(6, 10))
                >>> _ = glyph.plot()
                >>> _ = glyph.apply_style("topography")
                >>> glyph.style
                'topography'

                ```
            - `compose=True` is refused, and the glyph keeps the style it had:
                ```python
                >>> import matplotlib
                >>> matplotlib.use("Agg")
                >>> import numpy as np
                >>> from cleopatra.glyphs.gridded.array_glyph import ArrayGlyph
                >>> glyph = ArrayGlyph(np.arange(60.0).reshape(6, 10))
                >>> _ = glyph.apply_style("topography")
                >>> glyph.apply_style("bathymetry", compose=True)
                Traceback (most recent call last):
                    ...
                ValueError: apply_style() re-renders in place and clears the axes first, ...
                >>> glyph.style
                'topography'

                ```
        """
        resolve_single_layer_style(style)
        if kwargs.get("compose"):
            raise ValueError(
                "apply_style() re-renders in place and clears the axes first, so "
                "compose=True cannot be honoured here. To draw a styled layer "
                "over what is already on an axes, call "
                "plot(data_style=DataStyle(style=...), ax=..., compose=True)."
            )
        self._reset_axes_for_restyle()
        # Fold style (and an optional forwarded hillshade) into the grouped
        # data_style object; leaving hillshade unset keeps any sticky value.
        if "hillshade" in kwargs:
            data_style = DataStyle.for_apply_style(
                style, hillshade=kwargs.pop("hillshade")
            )
        else:
            data_style = DataStyle.for_apply_style(style)
        return self.plot(data_style=data_style, ax=self.ax, **kwargs)

    def _resolve_style_layer(self, style: str) -> str:
        """Validate a `DATA_STYLES` name and return its single layer key.

        A raster band is one field, so only single-layer presets apply. The
        style name is the layer name for every single-layer preset
        (`flow_accumulation`, `flow_direction_d8`, topography, each Magics /
        cmocean entry).

        Args:
            style: A key of `cleopatra.styling.colors.DATA_STYLES`.

        Returns:
            The preset's single layer name.

        Raises:
            ValueError: If `style` is unknown, or names a multi-layer preset
                (which cannot be applied to a single raster band).
        """
        return resolve_single_layer_style(style)[0]

    def _style_cbar_kw(self, norm: Normalize) -> dict:
        """Colorbar tick kwargs for a real colorbar drawn over a `style` preset.

        A preset's norm is often a banded `BoundaryNorm` whose many raw
        boundaries would over-crowd the axis, so derive a clean, readable set of
        ~8 ticks across `norm`'s range for `create_color_bar` instead. Falls
        back to matplotlib's auto-ticking when the norm has no finite range.

        Args:
            norm: The preset's colour norm (carries the data-range vmin/vmax).

        Returns:
            dict: `{"ticks": [...]}`, or `{}` to let matplotlib auto-tick.
        """
        lo = getattr(norm, "vmin", None)
        hi = getattr(norm, "vmax", None)
        if lo is None or hi is None or lo == hi:
            return {}
        ticks = [
            float(t) for t in MaxNLocator(nbins=8).tick_values(lo, hi) if lo <= t <= hi
        ]
        return {"ticks": ticks} if ticks else {}

    def _apply_style_background(self, cfg: dict[str, Any]) -> None:
        """Paint the preset's canvas colour on this glyph's figure + axes.

        A preset whose look depends on a tinted canvas -- e.g. the flame glow,
        which fades to transparent at the cool end and only reads on black --
        carries a `background` colour (see the preset schema). Apply it to the
        axes (behind the data) and the figure patch (the crop margin, and the
        GIF background), scoped to this glyph, so no global `rcParams` mutation
        is needed. `savefig.facecolor='auto'` means a saved still or GIF inherits
        it too.

        Args:
            cfg: The resolved layer config; its `background` key, when present,
                is the canvas colour.
        """
        background = cfg.get("background")
        if background is None:
            return
        if self.ax is not None:
            self.ax.set_facecolor(background)
        if self.fig is not None and getattr(self, "_owns_figure", False):
            self.fig.patch.set_facecolor(background)

    def _plot_with_style(
        self, style: str, compose: bool = False
    ) -> tuple[Figure, Axes]:
        """Render the array with a named `DATA_STYLES` preset.

        Delegates the drawing to `cleopatra.styling.colors.apply_data_style` so the
        preset's colormap, norm (`linear`/`log`/`symlog`/diverging `center`),
        transparent nodata, optional alpha glow, and — for categorical presets
        — the discrete `disjoint_legend` are reproduced exactly. The preset's
        swatch / categorical legend stands in for the colorbar, so `self.cbar`
        is left `None`. `add_colorbar=False` suppresses that legend, and so does
        `compose=True` on its own -- see `Glyph._draws_own_colorbar`.

        Args:
            style: A `DATA_STYLES` name (see `_resolve_style_layer`).
            compose: Draw over what is already on the axes rather than replacing
                it. Forwarded from `plot`, which would otherwise honour it on
                its own render paths and silently ignore it on this one. Beyond
                keeping the prior artists, it leaves the host's canvas colour,
                projection frame, empty title and pixel-space tick labels alone
                -- a preset's dark background belongs to the figure it was drawn
                for -- and defaults the swatch / legend off. A placement-bearing
                `colorbar=` still draws a real bar over the swatch.

        Returns:
            tuple[Figure, Axes]: The figure and axes drawn on.
        """
        layer, style_cfg = resolve_single_layer_style(style)
        _clear_prior_render_artists(self.ax, self, compose=compose)
        # A composed overlay owns neither the canvas nor the frame. A preset's
        # dark background belongs to the figure it was drawn for, and tearing
        # down the projection frame would strip the graticule the host put there.
        if not compose:
            self._apply_style_background(style_cfg)
            self._sync_projection_frame(
                projection_draws_frame(self.default_options.get("projection"))
            )
        data = np.asarray(
            ma.filled(ma.asarray(self.arr).astype(float), np.nan), dtype=float
        )
        legend = self._draws_own_colorbar(compose)
        override_colorbar = (
            self._style_wants_colorbar and style_cfg.get("categories") is None
        )
        draw_swatch = legend and not override_colorbar
        self.im = self._render_styled_layer(layer, data, style, draw_swatch)

        self._compose_style_hillshade(style, data)
        self.cbar = (
            self._style_override_colorbar(data, style_cfg)
            if override_colorbar
            else None
        )
        # See `plot`: a pixel-space render hides its indices, but never on a
        # host's axes it is only composing onto.
        if not compose and self.extent is None and self._coords is None:
            self.ax.set_xticklabels([])
            self.ax.set_yticklabels([])
            self.ax.set_xticks([])
            self.ax.set_yticks([])
        if not compose or self.default_options["title"]:
            self.ax.set_title(
                self.default_options["title"],
                fontsize=self.default_options["title_size"],
                pad=_multiline_title_pad(
                    self.ax,
                    self.default_options["title"],
                    self.default_options["title_size"],
                ),
            )
        self._apply_axis_style(self.ax)
        _mark_render_artists(self.ax, self, self.cbar, self.im)
        return cast(Figure, self.fig), self.ax

    def _flat_axis_bounds(self) -> tuple[float, float, float, float]:
        """Return the `(x_min, x_max, y_min, y_max)` axis limits of the flat view.

        Used both to reframe the axes when reverting from a projection (see
        `_sync_projection_frame`, which *sorts* the values) and to seed a fresh
        axes for the pre-plot basemap builder flow (see `GeoMixin._basemap_axes`,
        which applies them verbatim). From the lon/lat coords if present, else the
        `extent`, else the pixel grid -- and the pixel branch returns the *render*
        limits of `matshow(origin="upper")` (row 0 at the top, half-pixel cell
        edges), so its y is inverted (`y_min > y_max`); a raw `set_ylim` then
        matches the plain plot instead of flipping the raster upside-down.

        Returns:
            tuple[float, float, float, float]: The flat-render axis limits.
        """
        if self._coords is not None:
            x, y = self._coords
            return (
                float(np.min(x)),
                float(np.max(x)),
                float(np.min(y)),
                float(np.max(y)),
            )
        if self.extent is not None:
            x0, x1, y0, y1 = self.extent
            return float(x0), float(x1), float(y0), float(y1)
        n_rows, n_cols = np.asarray(self.arr).shape[:2]
        return -0.5, float(n_cols) - 0.5, float(n_rows) - 0.5, -0.5

    def _sync_projection_frame(self, projecting: bool) -> None:
        """Strip a prior globe frame and, when reverting to flat, restore the view.

        `ArrayGlyph` reuses its own axes across `plot()` calls, and a globe render
        freezes the view / hides the axis (`apply_projection_frame`). So before a
        non-projection render on the same axes, the stale frame must be removed and
        the flat view restored, or the flat layer is drawn into a frozen, axis-off
        view as an invisible speck. A new globe render stashes its own frame in the
        projection render path, so here we only clear the prior frame; the view is
        restored only when this render is flat.

        Args:
            projecting: Whether this render is itself a projection (globe) render.
        """
        had_frame = _clear_projection_frame(self.ax)
        if had_frame and not projecting:
            x_min, x_max, y_min, y_max = self._flat_axis_bounds()
            _restore_flat_axes(self.ax, x_min, x_max, y_min, y_max, aspect="auto")

    def _render_styled_layer(
        self, layer: str, data: np.ndarray, style: str, draw_swatch: bool
    ) -> Any:
        """Draw the styled layer via `apply_data_style`; return its image artist.

        Forwards the caller's explicit per-call preset overrides (from
        `_style_color_overrides` -- vmin/vmax/center plus cmap/extend/levels/
        bands/alpha/alpha_range) so they override the preset's own values,
        and colours the swatch legend to contrast with its box.
        """
        box = self.default_options.get("cbar_box")
        swatch_kw = {
            "legend": draw_swatch,
            "swatch_text_color": self.default_options.get("cbar_label_color")
            or _swatch_text_default(box),
            "swatch_value_color": self.default_options.get("cbar_tick_color")
            or _swatch_text_default(box),
            "swatch_box": box,
        }
        override = dict(self._style_color_overrides)
        coords = self._coords
        projection = self.default_options.get("projection")
        if projection:
            if coords is None or coords[0].ndim != 1 or coords[1].ndim != 1:
                raise ValueError(
                    "projection= with a style requires 1-D lon/lat coordinate "
                    "vectors (build the glyph with coords=(lon, lat))."
                )
            before = set(map(id, self.ax.patches)) | set(map(id, self.ax.lines))
            x_edges, y_edges, masked = apply_projection_style(
                self.ax, coords[0], coords[1], data, style=projection
            )
            _stash_projection_frame(
                self.ax,
                [a for a in (*self.ax.patches, *self.ax.lines) if id(a) not in before],
            )
            images = apply_data_style(
                self.ax,
                {layer: masked},
                style=style,
                x=x_edges,
                y=y_edges,
                shading="flat",
                **swatch_kw,
                **override,
            )
        elif coords is not None:
            images = apply_data_style(
                self.ax,
                {layer: data},
                style=style,
                x=coords[0],
                y=coords[1],
                shading="nearest",
                **swatch_kw,
                **override,
            )
        else:
            render_kwargs: dict[str, Any] = (
                {"extent": self.extent} if self.extent is not None else {}
            )
            images = apply_data_style(
                self.ax,
                {layer: data},
                style=style,
                **swatch_kw,
                **render_kwargs,
                **override,
            )
        return images[layer]

    def _compose_style_hillshade(self, style: str, data: np.ndarray) -> None:
        """Blend terrain hillshade into a continuous-preset image (regular grid only).

        NOT applied to a categorical preset (shading nominal class colours is
        meaningless) nor to a curvilinear `QuadMesh` (no 2D RGBA grid to light);
        both cases warn and leave the preset as drawn.
        """
        hillshade = resolve_hillshade(self.default_options.get("hillshade"))
        if hillshade is None:
            return
        categorical = resolve_single_layer_style(style)[1].get("categories") is not None
        if categorical or self._coords is not None:
            kind = "categorical" if categorical else "curvilinear"
            warnings.warn(
                f"hillshade is not composed with a {kind} data-style preset; "
                "the preset is applied and hillshade ignored.",
                stacklevel=2,
            )
            return
        self.im.set_data(shade_rgb(self.im.get_array(), data, **hillshade))

    def _style_override_colorbar(self, data: np.ndarray, style_cfg: dict) -> Colorbar:
        """Build a real colorbar from the preset's cmap + norm (overriding the swatch).

        The drawn image bakes RGBA, so it cannot itself drive a colorbar; hand a
        `ScalarMappable` carrying the preset's colormap + norm to
        `create_color_bar`, which honours the `ColorBar` placement.
        """
        cbar_cfg = {**style_cfg, **resolve_style_overrides(self._style_color_overrides)}
        cbar_norm, _lo, _hi = resolve_style_norm(data, cbar_cfg)
        mappable = ScalarMappable(
            norm=cbar_norm, cmap=resolve_colormap(cbar_cfg["cmap"])
        )
        mappable.set_array([])
        return self.create_color_bar(self.ax, mappable, self._style_cbar_kw(cbar_norm))

    def apply_colormap(self, cmap: Colormap | str) -> np.ndarray:
        """Apply a matplotlib colormap to an array.

            Create an RGB channel from the given array using the given colormap.

        Args:
            cmap: colormap.

        Returns:
            np.ndarray: 8-bit array with the colormap applied.

        Examples:
        - Create an array and instantiate the `Array` object:
        ```python
        >>> import numpy as np
        >>> arr = np.array([[1, 2, 3], [4, 5, 6], [7, 8, 9]])
        >>> array = ArrayGlyph(arr)
        >>> rgb_array = array.apply_colormap("coolwarm_r")
        >>> print(rgb_array) # doctest: +SKIP
        [[[179   3  38]
          [221  96  76]
          [244 154 123]]
         [[244 196 173]
          [220 220 221]
          [183 207 249]]
         [[139 174 253]
          [ 96 128 232]
          [ 58  76 192]]]

        >>> print(rgb_array.dtype)
        uint8

        ```
        """
        colormap = resolve_colormap(cmap)
        normed_data = (self.arr - self.arr.min()) / (self.arr.max() - self.arr.min())
        colored = colormap(normed_data)
        return np.asarray((colored[:, :, :3] * 255).astype("uint8"))

    def to_image(self, arr: np.ndarray | None = None) -> Image.Image:
        """Create an RGB image from an array.

            convert the array to an image.

        Args:
            arr: array. if None, the array in the object will be used.

        Returns:
            PIL.Image.Image: An RGB image built from the array (values
                scaled to the 0-255 `uint8` range unless already `uint8`).

        Examples:
        ```python
        >>> import numpy as np
        >>> arr = np.array([[1, 2, 3], [4, 5, 6], [7, 8, 9]])
        >>> array = ArrayGlyph(arr)
        >>> image = array.to_image()
        >>> print(image) # doctest: +SKIP
        <PIL.Image.Image image mode=RGB size=3x3 at 0x7F5E0D2F4C40>

        ```
        """
        if arr is None:
            arr = self.arr
        arr = arr if arr.dtype == "uint8" else self.scale_to_rgb()
        return Image.fromarray(arr).convert("RGB")

    def scale_to_rgb(
        self,
        arr: np.ndarray | None = None,
        per_band: bool = False,
        percentile: tuple[float, float] = (2.0, 98.0),
    ) -> np.ndarray:
        """Scale an array to the 0-255 ``uint8`` range for RGB rendering.

        Two modes are available:

        - **Global (default, `per_band=False`):** scale the whole array by a
          single maximum (`arr * 255 / arr.max()`). Suitable for a single
          band or when all bands share a range.
        - **Per-band percentile stretch (`per_band=True`):** stretch each band
          (the last axis of a ``(rows, cols, bands)`` array) independently
          between its `percentile` low/high cut, clip to that range, and map
          to 0-255. This is the contrast stretch typically wanted for true
          RGB composites where bands have different dynamic ranges. A band
          with no usable range (all-NaN, or flat where the two cuts coincide)
          has nothing to stretch and is returned as a flat zero band.

        Args:
            arr: Array to scale. If None, the glyph's own array is used.
                For `per_band=True` it must be 3-D ``(rows, cols, bands)``.
            per_band: When True, stretch each band independently using
                `percentile`. When False (default), use the legacy single
                global-max scaling. Defaults to False.
            percentile: ``(low, high)`` percentile cuts for the per-band
                stretch, by default ``(2.0, 98.0)``. Ignored when
                `per_band` is False.

        Returns:
            np.ndarray: A ``uint8`` array of the same shape as the input,
                with values in 0-255. The input array is not modified.

        Raises:
            ValueError: If `per_band=True` and `arr` is not a 3-D
                ``(rows, cols, bands)`` array.

        Examples:
            - Global scaling of a single band (default):
                ```python
                >>> import numpy as np
                >>> arr = np.array([[1, 2, 3], [4, 5, 6], [7, 8, 9]])
                >>> array = ArrayGlyph(arr)
                >>> rgb_array = array.scale_to_rgb()
                >>> print(rgb_array)
                [[28 56 85]
                 [113 141 170]
                 [198 226 255]]
                >>> print(rgb_array.dtype)
                uint8

                ```
            - Per-band percentile stretch of a 3-band composite (each band
              spans the full 0-255 range independently):
                ```python
                >>> import numpy as np
                >>> rng = np.random.default_rng(0)
                >>> stack = rng.uniform(10, 200, size=(8, 8, 3))
                >>> array = ArrayGlyph(np.zeros((4, 4)))   # any 2-D placeholder
                >>> out = array.scale_to_rgb(stack, per_band=True)
                >>> out.shape, out.dtype
                ((8, 8, 3), dtype('uint8'))
                >>> int(out[..., 0].min()), int(out[..., 0].max())
                (0, 255)

                ```
        """
        if arr is None:
            arr = self.arr

        if per_band:
            arr = np.asarray(arr, dtype="float64")
            if arr.ndim != 3:
                raise ValueError(
                    "per_band=True requires a 3-D (rows, cols, bands) array; "
                    f"got {arr.ndim}-D shape {arr.shape}."
                )
            lo_p, hi_p = percentile
            out = np.empty(arr.shape, dtype="float64")
            for band in range(arr.shape[-1]):
                values = arr[..., band]
                with warnings.catch_warnings():
                    warnings.simplefilter("ignore", RuntimeWarning)
                    lo, hi = np.nanpercentile(values, [lo_p, hi_p])
                if not (np.isfinite(lo) and np.isfinite(hi)) or hi <= lo:
                    out[..., band] = 0.0
                    continue
                out[..., band] = np.clip((values - lo) / (hi - lo), 0.0, 1.0)
            out = np.nan_to_num(out, nan=0.0)
            return (out * 255).astype("uint8")

        denominator = arr.max() or 1
        return (arr * 255 / denominator).astype("uint8")

    @staticmethod
    def _plot_text(
        ax: Axes, arr: np.ndarray, indices, default_options_dict: dict
    ) -> list:
        """plot values as a text in each cell.

        Args:
            ax: matplotlib axes.
            arr: numpy array.
            indices: array with columns, (row, col).
            default_options_dict: default options dictionary after updating the options.

        Returns:
            list: list of the text object.
        """
        add_text = lambda elem: ax.text(
            elem[1],
            elem[0],
            np.round(arr[elem[0], elem[1]], 2),
            ha="center",
            va="center",
            color="w",
            fontsize=default_options_dict["num_size"],
        )
        return list(map(add_text, indices))

    def _apply_kwargs_and_colorbar(
        self, colorbar: bool | ColorBar | None, kwargs: dict
    ) -> dict:
        """Fold loose kwargs and `colorbar=` into `default_options`; set style flags.

        Shared by `plot` and `animate`: validates and applies each loose keyword
        into `default_options`, merges the resolved `colorbar=` spec last (so it
        wins over a same-named loose key), records this call's colour-limit
        overrides for a preset render, and sets `_style_wants_colorbar` -- a
        placement-bearing `colorbar=` (`location`, `inside`, `orientation`, or
        `True`) draws a real colorbar over a preset's swatch, while a spec
        carrying only colours/box styles the swatch in place.

        It also records `_render_explicit_options`: the constructor's explicit
        keys plus this call's, which `Glyph._apply_axis_style` honours in place
        of `_explicit_options` and `Glyph._draws_own_colorbar` reads to tell an
        asked-for colorbar from the default one. Rebuilt per call rather than
        accumulated, and kept separate from `_explicit_options`, for the reasons
        set out at the assignment.

        Args:
            colorbar: The `colorbar=` argument (`bool`, `ColorBar`, or `None`).
            kwargs: The remaining `plot` / `animate` keyword arguments.

        Returns:
            The resolved `colorbar` option dict, so the caller can honour a
            spec-provided `ticks_spacing` before auto-computing it.
        """
        _reject_grouped_kwargs(kwargs)
        _reject_loose_alpha(kwargs)
        _reject_loose_fill(kwargs)
        for key, val in kwargs.items():
            if key not in self.default_options.keys():
                raise ValueError(
                    f"The given keyword argument:{key} is not correct, possible parameters are,"
                    f" {DEFAULT_OPTIONS}"
                )
            else:
                self.default_options[key] = val
        # A key passed here is as explicit as one passed to the constructor:
        # `_apply_axis_style` only applies options the caller actually asked for,
        # so without this `plot(xlabel=...)` would be accepted and dropped while
        # `ArrayGlyph(xlabel=...)` worked. Recorded only once every key has
        # validated, so a call that raises part-way leaves nothing behind for the
        # next one to pick up.
        #
        # Deliberately a separate set from `_explicit_options`, and rebuilt
        # rather than accumulated: `create_figure_axes` reads `_explicit_options`
        # to decide whether to override `figsize` with an auto-computed one, so
        # folding render kwargs into it would quietly change what
        # `plot(figsize=...)` does; and a set that only grew would keep
        # re-applying an option on later calls that did not pass it, overwriting
        # whatever the caller had since set on the axes themselves.
        self._render_explicit_options = getattr(self, "_explicit_options", set()) | set(
            kwargs
        )
        resolved_colorbar = _resolve_colorbar(colorbar)
        self.default_options.update(resolved_colorbar)
        for key in _STYLE_OVERRIDE_KEYS:
            if key in kwargs and kwargs[key] is not None:
                self._style_color_overrides[key] = kwargs[key]
        # `levels`/`bands`/`alpha`/`alpha_range` are grouped kwargs
        # (`contour=Contour(levels=...)`, `data_style=DataStyle(bands=...,
        # alpha=..., alpha_range=...)`), so they are never loose keys -- they
        # arrive via `_merge_group_params` into `default_options` (defaults
        # `None`). Reconcile the sticky override slice with `default_options`
        # every call: a set value overrides the preset (and carries into a later
        # `animate`), while an explicit `None` -- what `DataStyle(bands=None)` /
        # `alpha=None` emits -- clears any previously-applied override so the
        # preset's own value is restored.
        for key in _STYLE_GROUP_OVERRIDE_KEYS:
            group_override = self.default_options.get(key)
            if group_override is not None:
                self._style_color_overrides[key] = group_override
            else:
                self._style_color_overrides.pop(key, None)
        self._style_wants_colorbar = colorbar is True or (
            isinstance(colorbar, ColorBar) and colorbar.specifies_placement()
        )
        return resolved_colorbar

    def _plot_projected(
        self,
        ax: Axes,
        arr: np.ndarray,
        norm: Normalize | None,
        cbar_kw: dict,
        ticks: np.ndarray,
    ) -> tuple[Any, dict[str, str]]:
        """Render the array through a projection preset (`"globe"` / `"flat"`).

        Reprojects the 1-D lon/lat field with
        `cleopatra.basemap.projection.apply_projection_style` (which also draws the globe
        boundary + graticule and masks the far hemisphere), then colours the
        reprojected cells with `pcolormesh(..., shading="flat")` at the projected
        cell **edges**. The colour norm/cmap come from the same resolution path
        as the flat render, so `color_scale` / `vmin` / `vmax` / `cmap` behave
        identically. The globe path needs `pyproj` (the `[tiles]` extra).

        Args:
            ax: Axes to draw on.
            arr: The (masked) 2-D data array.
            norm: The resolved matplotlib norm (`None` for a plain linear scale).
            cbar_kw: The resolved colorbar keyword-argument dict.
            ticks: The resolved colorbar ticks; drive `vmin`/`vmax` when the
                norm is linear.

        Returns:
            tuple: `(QuadMesh, cbar_kw)` -- the mappable and its colorbar kwargs.
        """
        projection = self.default_options["projection"]
        lon, lat = self._coords
        cmap = resolve_colormap(self.default_options["cmap"])
        plot_arr = (
            ma.filled(ma.asarray(arr).astype(float), np.nan)
            if isinstance(arr, ma.MaskedArray)
            else np.asarray(arr, dtype=float)
        )
        before = set(map(id, ax.patches)) | set(map(id, ax.lines))
        x_edges, y_edges, masked = apply_projection_style(
            ax, lon, lat, plot_arr, style=projection
        )
        _stash_projection_frame(
            ax, [a for a in (*ax.patches, *ax.lines) if id(a) not in before]
        )
        if norm is None:
            im = ax.pcolormesh(
                x_edges,
                y_edges,
                masked,
                cmap=cmap,
                vmin=ticks[0],
                vmax=ticks[-1],
                shading="flat",
            )
        else:
            im = ax.pcolormesh(
                x_edges, y_edges, masked, cmap=cmap, norm=norm, shading="flat"
            )
        return im, cbar_kw

    def plot(
        self,
        points: PointOverlay | None = None,
        kind: str = "auto",
        ax: Axes | None = None,
        title: str | None = None,
        color: ColorScaling | Normalize | None = None,
        contour: Contour | None = None,
        cells: CellValues | None = None,
        classify: Classify | None = None,
        data_style: DataStyle | None = None,
        full_bleed: bool | str = False,
        basemap: bool | dict | Basemap | Callable[[Any], None] | None = None,
        colorbar: bool | ColorBar | None = None,
        compose: bool = False,
        **kwargs: Unpack[PlotKwargs],
    ) -> tuple[Figure, Axes]:
        """Plot the array with customizable visualization options.

        This method creates a visualization of the array with various customization options
        including color scales, color bars, cell value display, and point annotations.
        It supports both regular arrays and RGB arrays.

        Args:
            points: Points to display on the array, by default None. A
                `PointOverlay` bundling the `(N, 3)` array of
                `[value, row, col]` per point together with the marker /
                value-label styling (`color` / `size` / `label_color` /
                `label_size`).
            kind: Render kind, by default `"auto"`. One of:

                - `"auto"` — picks the best renderer for the data.
                  Routes to `"pcolormesh"` when curvilinear /
                  non-uniform `coords` were passed to the
                  constructor, otherwise falls back to `"imshow"`.
                - `"imshow"` — pixel-grid raster render via
                  `ax.imshow`/`matshow`. Honours `extent`.
                  Incompatible with `coords`.
                - `"pcolormesh"` — quadrilateral mesh render via
                  `ax.pcolormesh` with `shading="auto"`. Honours
                  `coords` (1-D centres or 2-D curvilinear).
                - `"contour"` — line contours via `ax.contour`.
                  Honours `levels` from kwargs when set.
                - `"contourf"` — filled contours via `ax.contourf`.
                  Honours `levels` from kwargs when set.

                Cell-value display and point overlays only apply to
                `"imshow"` and `"pcolormesh"`; they are silently
                skipped for `"contour"` and `"contourf"` (which have
                no per-cell grid). RGB compositing requires
                `kind="imshow"`.
            ax: Target axes to draw on, by default None. When given,
                the plot is composed into this axes (and its parent
                figure, via `ax.get_figure()`), mirroring the other
                glyphs' `plot(ax=...)`. Resolution priority is
                `plot(ax=)` > the axes bound at construction > an axes
                derived from a figure bound at construction > a fresh
                figure/axes. `fig` is intentionally not a parameter
                here — it is a construction-time binding derived from
                the axes.
            title: Plot title, by default None. A convenience shortcut
                equivalent to the `title` option; when given it
                overrides the `title` set at construction.
            color: Colour-scale group object
                (`cleopatra.styling.scaling.ColorScaling`) selecting the
                norm and its knobs, e.g. `ColorScaling.power(gamma=0.7)` or
                `ColorScaling.boundary(bounds=[...])`. Replaces the former
                loose `color_scale` / `gamma` / `line_threshold` /
                `line_scale` / `bounds` / `midpoint` keywords.
            contour: Contour/discretisation group object
                (`cleopatra.styling.params.Contour`), e.g.
                `Contour(levels=5)` or `Contour(labels=True,
                label_kw={"fmt": "%.2f"})`. Replaces the loose `levels` /
                `labels` / `label_kw` keywords.
            cells: Per-cell value-text group object
                (`cleopatra.styling.params.CellValues`), e.g.
                `CellValues(show=True, size=8)`. Replaces the loose
                `display_cell_value` / `num_size` /
                `background_color_threshold` keywords.
            classify: Value-classification group object
                (`cleopatra.styling.params.Classify`), by default `None`
                (a continuous colour scale). Bins the array's finite cells into
                discrete colour classes drawn with a stepped colorbar, e.g.
                `Classify(scheme="quantiles", k=5)`,
                `Classify(scheme="natural_breaks", k=7)`, or explicit edges
                `Classify(scheme=[0, 10, 50, 100, 500])`. The scheme owns the
                norm, so `color`'s `color_scale` / `levels` are ignored when it
                is set (a warning says so), and the classes are derived from the
                data itself -- a caller `vmin` / `vmax` does not constrain them
                (pass explicit edges to pin the class boundaries instead).
                `scheme="categorical"` is rejected for a raster (its cells are a
                continuous field), so a `Classify.category_legend_kwargs` is
                accepted but has no effect here. A `data_style` preset owns the
                colour mapping outright, so `classify` is ignored when `style` is
                set (a warning says so).
            data_style: Named-preset / relief-shading group object
                (`cleopatra.styling.params.DataStyle`), e.g.
                `DataStyle(style="dem", hillshade=True)` or
                `DataStyle(style="temperature_2m", bands=6, alpha=0.5)`.
                Replaces the loose `style` / `hillshade` keywords and the
                per-call preset overrides `bands` / `alpha` / `alpha_range`.
            full_bleed: Fill the whole figure edge-to-edge with no surrounding
                margin, by default False. `True` hides ticks and spines and
                resizes the figure to the data box's aspect so the fill has no
                distortion, leaving the canvas colour untouched (masked / no-data
                cells keep the default background). Pass a colour string instead
                (e.g. `"black"`) to also paint the canvas that colour -- e.g. so
                a semi-transparent relief reads dark. Same flag as
                `animate(full_bleed=...)`. Intended for chrome-free maps -- a
                colorbar or title has no room, so pair it with
                `add_colorbar=False` and omit the title (an outside colorbar is
                otherwise left floating over the filled axes); a scale swatch
                (from `style`) still fits inside. It resizes the whole figure and
                gives its axes the entire canvas, so use a dedicated figure --
                passing `ax=` one subplot of several lets `full_bleed` take over
                the figure and hide the siblings.
            basemap: A reference backdrop drawn via the glyph's own
                `add_relief` / `add_features`, composed by `zorder` (relief
                under the data, coastline/borders over it), by default None (no
                basemap). Accepts ``True`` for a sensible default (a `"low"`
                relief plus grey `"50m"` coastline and borders), a `Basemap`
                (the typed, validated form -- `relief` / `features` /
                `resolution` / `check_alignment`, with `features` taking
                `Feature` objects), a **dict** with the same keys (see
                `GeoMixin._draw_basemap`), or a **callable** ``f(glyph)`` for
                full control. Same flag as `animate(basemap=...)`. On a
                projected axis, set `self.crs` first so the relief is warped to
                match the data. Drawing the relief needs the `[tiles]` extra
                (Pillow, and pyproj for a non-4326 `crs`).
            compose: Draw *over* whatever is already on `ax` instead of
                replacing it, leaving another glyph's layers, colorbar and ticks
                intact, along with the host's title unless this glyph carries
                one of its own -- and, on a `style=` preset, the host's canvas
                colour and projection frame too. Off by default, where a render
                replaces every glyph's artists on the axes (see issue #210).
                Turn it on to lay one field over another. An overlay also draws
                **no colorbar of its own** by default: `fig.colorbar()` takes
                its space from the host axes, so a stack of overlays would
                re-lay-out the host once per layer. Pass `colorbar=` or
                `add_colorbar=True` (at construction or on the call) to get one
                anyway.
            colorbar: Colorbar presence and placement. `None` (default) keeps
                matplotlib's placement (honouring the legacy `add_colorbar`);
                `False` draws no colorbar; `True` a default one. Under
                `compose=True`, passing anything but `None` here also counts as
                asking for the overlay's own colorbar, which is otherwise off.
                Pass a `ColorBar` for control -- an edge (`location`), an
                `inside` inset that tracks `full_bleed`, a backing `box`
                (defaulted on for an inset), and text colours (`label_color` for
                the title, `tick_color` for the tick numbers). Same flag as
                `animate(colorbar=)`.
                On a `style=` preset, a placement `ColorBar` (or `True`) overrides
                the swatch with a real colorbar; a colours-only `ColorBar` styles
                the swatch in place (defaults < preset < explicit).
            **kwargs: Additional keyword arguments for customizing the plot.

                Plot appearance:
                    title : str, optional
                        Title of the plot, by default 'Array Plot'.
                    title_size : int, optional
                        Title font size, by default 15.
                    cmap : str or matplotlib.colors.Colormap, optional
                        Colormap, by default 'coolwarm_r'. A plain matplotlib
                        name (e.g. 'viridis') or a `Colormap` object is used
                        as-is; a **namespaced** name such as 'cmocean:thermal'
                        or 'cmasher:ember' is resolved via the optional `cmap`
                        aggregator — install the `[science-colors]` extra
                        (`pip install cleopatra[science-colors]`). The `_r`
                        reverse suffix works on both forms.
                    vmin : float, optional
                        Minimum value for color scaling, by default min(array).
                    vmax : float, optional
                        Maximum value for color scaling, by default max(array).

                Color bar options:
                    add_colorbar : bool, optional
                        Whether to draw the glyph's own color bar, by
                        default True -- except under `compose=True`, which
                        defaults it off so an overlay does not take space
                        from the host axes; passing it there (`True` or
                        `False`) still decides the matter. With it off
                        `self.cbar` stays None, no axes space is taken by a
                        color bar, and the mappable is still reachable via
                        `self.im`.
                        Note: for a constant-value field rendered as line
                        `contour` there are no contour lines to map, so the
                        color bar is skipped (with a warning) even when
                        `add_colorbar` is True, and `self.cbar` stays None.
                    cbar_orientation : str, optional
                        Prefer `colorbar=ColorBar(orientation=...)`.
                        Orientation of the color bar, by default 'vertical'.
                        Can be 'horizontal' or 'vertical'.
                    cbar_label_rotation : float, optional
                        Prefer `colorbar=ColorBar(label_rotation=...)`.
                        Rotation angle (degrees) of the color bar label, by
                        default None (matplotlib's own label orientation).
                    cbar_label_location : str, optional
                        Prefer `colorbar=ColorBar(label_location=...)`.
                        Location of the color bar label, by default 'center'.
                        Valid values depend on the bar orientation -- vertical:
                        'top'/'center'/'bottom'; horizontal: 'left'/'center'/'right'.
                    cbar_length : float, optional
                        Prefer `colorbar=ColorBar(length=...)`. Ratio to
                        control the height/width of the color bar, by default 0.75.
                    ticks_spacing : int, optional
                        Prefer `colorbar=ColorBar(ticks_spacing=...)`.
                        Spacing between ticks on the color bar, by default 5.
                    cbar_label_size : int, optional
                        Prefer `colorbar=ColorBar(label_size=...)`. Font
                        size of the color bar label, by default 12.
                    cbar_label : str, optional
                        Prefer `colorbar=ColorBar(label=...)`. Label text
                        for the color bar, by default None.

                Colour scale (moved to the `color=` object):
                    The colour-scale options (`color_scale`, `gamma`,
                    `line_threshold`, `line_scale`, `bounds`, `midpoint`)
                    and the discretisation `levels` are now set through the
                    `color=` / `contour=` parameters -- see
                    `cleopatra.styling.scaling.ColorScaling` and
                    `cleopatra.styling.params.Contour`. Passing them as
                    loose keywords raises with a pointer to the object.

                Xarray-aligned colour kwargs:
                    robust : bool, optional
                        When True, use the 2nd and 98th percentile of
                        the unmasked data for `vmin` / `vmax`,
                        matching xarray's `robust=True` default. An
                        explicit `vmin` / `vmax` always wins. By
                        default False.
                    center : float, optional
                        Diverging-colormap centring value. When set,
                        `vmin` / `vmax` are made symmetric around
                        `center` (after `robust` has been applied),
                        and the cmap auto-switches to `"RdBu_r"` if
                        the caller did not pass an explicit `cmap`.
                        By default None (no centring).
                    extend : str, optional
                        Colorbar arrow extension. One of `"neither"`,
                        `"both"`, `"min"`, `"max"`, or None to
                        auto-resolve (`"both"` when `levels` is
                        set, otherwise `"neither"`). By default
                        None.
                    cbar_kwargs : dict, optional
                        Extra keyword arguments forwarded to
                        `fig.colorbar`. Merges over the defaults
                        computed by cleopatra so user keys win on
                        collision. Common keys: `label`, `shrink`,
                        `aspect`, `orientation`, `pad`,
                        `ticks`. By default None.

                Contour / cell-value / data-style (moved to group objects):
                    Contour labels (`labels`, `label_kw`) move to
                    `contour=Contour(...)`; per-cell value text
                    (`display_cell_value`, `num_size`,
                    `background_color_threshold`) moves to
                    `cells=CellValues(...)`; the named preset, relief
                    shading, and the per-call preset overrides (`style`,
                    `hillshade`, `bands`, `alpha`, `alpha_range`) move to
                    `data_style=DataStyle(...)`. See
                    `cleopatra.styling.params`. Passing any of them as a
                    loose keyword raises with a pointer to the object. A
                    continuous `data_style` preset still composes with its
                    `hillshade`; a categorical preset presents a discrete
                    legend and is not shaded.

                Other kwargs:
                    projection : str, optional
                        Draw the field on a projection preset: `"globe"`
                        (orthographic) or `"flat"`. Requires 1-D lon/lat
                        `coords=(lon, lat)`; the field is reprojected and, for
                        `"globe"`, the boundary + graticule are drawn. `"globe"`
                        needs `pyproj` (the `[tiles]` extra). By default None
                        (unprojected raster).

        Returns:
            tuple[matplotlib.figure.Figure, matplotlib.axes.Axes]: A tuple containing:
                - fig: The matplotlib Figure object
                - ax: The matplotlib Axes object

            The colour-mapped artist (the `ScalarMappable` — e.g. the
            `AxesImage` for `imshow`, the `QuadMesh` for
            `pcolormesh`, the `QuadContourSet` for
            `contour`/`contourf`, or the RGB `AxesImage`) is also
            stored on the instance as `self.im` after this call, so a
            caller can attach a colorbar/legend or query the colour
            limits without scraping `ax.images`/`ax.collections`.

        Raises:
            ValueError: If an invalid keyword argument is provided.

        Notes:
            This method does not call `plt.show()`; it returns the Figure and Axes so
            the caller can compose, save, or display them. In an interactive session call
            `plt.show()` yourself (or `fig.savefig(...)` to write the plot to disk)
            after `plot()` returns.

        Examples:
        - Basic array plot:

            ```python
            >>> import numpy as np
            >>> from cleopatra.glyphs.gridded.array_glyph import ArrayGlyph
            >>> arr = np.array([[1, 2, 3], [4, 5, 6], [7, 8, 9]])
            >>> array = ArrayGlyph(arr, figsize=(6, 6), title="Customized Plot", title_size=18)
            >>> fig, ax = array.plot()

            ```
        ![array-plot](./../images/array_glyph/array-plot.png)

        - Labelled line contours (`kind="contour"`, `labels=True`):

            - inline numeric labels are drawn on the isolines and the
                label `Text` artists are kept on `glyph.contour_labels`:
                ```python
                >>> from matplotlib.text import Text
                >>> y, x = np.mgrid[-3:3:30j, -3:3:30j]
                >>> z = np.exp(-(x**2 + y**2))
                >>> glyph = ArrayGlyph(z, figsize=(6, 6))
                >>> fig, ax = glyph.plot(
                ...     kind="contour", contour=Contour(labels=True, label_kw={"fmt": "%.2f"})
                ... )
                >>> bool(glyph.contour_labels) and all(
                ...     isinstance(t, Text) for t in glyph.contour_labels
                ... )
                True

                ```
                Without `labels` (the default) no labels are drawn and
                `contour_labels` stays `None`:
                ```python
                >>> glyph = ArrayGlyph(z, figsize=(6, 6))
                >>> fig, ax = glyph.plot(kind="contour")
                >>> glyph.contour_labels is None
                True

                ```

        - Color bar customization:

            - Create an array and instantiate the `Array` object with custom options.
                ```python
                >>> array = ArrayGlyph(arr, figsize=(6, 6), title="Customized color bar", title_size=18)
                >>> fig, ax = array.plot(
                ...     colorbar=ColorBar(
                ...         label="Discharge m3/s",
                ...         label_location="center",
                ...         length=0.7,
                ...         label_size=12,
                ...         ticks_spacing=5,
                ...         orientation="horizontal",
                ...     ),
                ...     color=ColorScaling.linear(),
                ...     cmap="coolwarm_r",
                ... )

                ```
                ![color-bar-customization](./../images/array_glyph/color-bar-customization.png)

        - Display values for each cell:

            - you can display the values for each cell by using thr parameter `display_cell_value`, and customize how
                the values are displayed using the parameter `background_color_threshold` and `num_size`.

                ```python
                >>> array = ArrayGlyph(arr, figsize=(6, 6), title="Display array values", title_size=18)
                >>> fig, ax = array.plot(
                ...     cells=CellValues(show=True, size=12),
                ... )

                ```
                ![display-cell-values](./../images/array_glyph/display-cell-values.png)

        - Plot points at specific locations in the array:

            - you can display points in specific cells in the array and also display a value for each of these points.
                The point overlay's array has the first column as the values to be displayed on top of the
                points, the second and third columns are the row and column index of the point in the array.
            - A `PointOverlay`'s `color`/`size` customize the appearance of the points, while `label_color`/
                `label_size` customize the appearance of each point's value label.

                ```python
                >>> from cleopatra.glyphs.gridded.array_glyph import PointOverlay
                >>> array = ArrayGlyph(arr, figsize=(6, 6), title="Display Points", title_size=14)
                >>> points = np.array([[1, 0, 0], [2, 1, 1], [3, 2, 2]])
                >>> overlay = PointOverlay(
                ...     points,
                ...     color="black",
                ...     size=100,
                ...     label_color="orange",
                ...     label_size=30,
                ... )
                >>> fig, ax = array.plot(points=overlay)

                ```
                ![display-points](./../images/array_glyph/display-points.png)

        - Color scale customization:

            - Power scale (with different gamma values).

                - The default power scale uses a gamma value of 0.5.

                    ```python
                    >>> array = ArrayGlyph(arr, figsize=(6, 6), title="Power scale", title_size=18)
                    >>> fig, ax = array.plot(
                    ...     colorbar=ColorBar(label="Discharge m3/s"),
                    ...     color=ColorScaling.power(),
                    ...     cmap="coolwarm_r",
                    ... )

                    ```
                    ![power-scale](./../images/array_glyph/power-scale.png)

                - change the gamma of 0.8 (emphasizes higher values less).

                    ```python
                    >>> array = ArrayGlyph(arr, figsize=(6, 6), title="Power scale - gamma=0.8", title_size=18)
                    >>> fig, ax = array.plot(
                    ...     color=ColorScaling.power(gamma=0.8),
                    ...     cmap="coolwarm_r",
                    ...     colorbar=ColorBar(label="Discharge m3/s"),
                    ... )

                    ```
                    ![power-scale-gamma-0.8](./../images/array_glyph/power-scale-gamma-0.8.png)

                - change the gamma of 0.1 (emphasizes higher values more).

                    ```python
                    >>> array = ArrayGlyph(arr, figsize=(6, 6), title="Power scale - gamma=0.1", title_size=18)
                    >>> fig, ax = array.plot(
                    ...     color=ColorScaling.power(gamma=0.1),
                    ...     cmap="coolwarm_r",
                    ...     colorbar=ColorBar(label="Discharge m3/s"),
                    ... )

                    ```
                    ![power-scale-gamma-0.1](./../images/array_glyph/power-scale-gamma-0.1.png)

            - Logarithmic scale.

                - the symmetric-log scale takes two parameters, `line_threshold` and `line_scale`. Leaving
                `line_threshold` unset (its default) auto-derives it from the data range so the colour bar's
                decades track the data's own scale; `line_scale` defaults to 0.001.
                    ```python
                    >>> array = ArrayGlyph(arr, figsize=(6, 6), title="Logarithmic scale", title_size=18)
                    >>> fig, ax = array.plot(
                    ...     colorbar=ColorBar(label="Discharge m3/s"),
                    ...     color=ColorScaling.sym_log(),
                    ...     cmap="coolwarm_r",
                    ... )

                    ```
                    ![log-scale](./../images/array_glyph/log-scale.png)

                - you can change the `line_threshold` and `line_scale` values.
                    ```python
                    >>> array = ArrayGlyph(
                    ...     arr, figsize=(6, 6), title="Logarithmic scale: Customized Parameter", title_size=12
                    ... )
                    >>> fig, ax = array.plot(
                    ...     colorbar=ColorBar(label="Discharge m3/s"),
                    ...     color=ColorScaling.sym_log(threshold=0.015, scale=0.1),
                    ...     cmap="coolwarm_r",
                    ... )

                    ```
                    ![log-scale](./../images/array_glyph/log-scale-custom-parameters.png)

            - Defined boundary scale.
                ```python
                >>> array = ArrayGlyph(arr, figsize=(6, 6), title="Defined boundary scale", title_size=18)
                >>> fig, ax = array.plot(
                ...     colorbar=ColorBar(label="Discharge m3/s"),
                ...     color=ColorScaling.boundary(),
                ...     cmap="coolwarm_r",
                ... )

                ```
                ![boundary-scale](./../images/array_glyph/boundary-scale.png)

                - You can also define the boundaries.
                    ```python
                    >>> array = ArrayGlyph(
                    ...     arr, figsize=(6, 6), title="Defined boundary scale: defined bounds", title_size=18
                    ... )
                    >>> bounds = [0, 5, 10]
                    >>> fig, ax = array.plot(
                    ...     colorbar=ColorBar(label="Discharge m3/s"),
                    ...     color=ColorScaling.boundary(bounds=bounds),
                    ...     cmap="coolwarm_r",
                    ... )

                    ```
                    ![boundary-scale-defined-bounds](./../images/array_glyph/boundary-scale-defined-bounds.png)

            - Midpoint scale.

                in the midpoint scale you can define a value that splits the scale into half.
                ```python
                >>> array = ArrayGlyph(arr, figsize=(6, 6), title="Midpoint scale", title_size=18)
                >>> fig, ax = array.plot(
                ...     colorbar=ColorBar(label="Discharge m3/s"),
                ...     color=ColorScaling.midpoint(at=2),
                ...     cmap="coolwarm_r",
                ... )

                ```
                ![midpoint-scale-costom-parameters](./../images/array_glyph/midpoint-scale-costom-parameters.png)

        - Render kinds (`kind=`):

            - `"pcolormesh"` for a quadrilateral mesh render. Note
                that `pcolormesh` does not honour `extent`, so the
                axes are drawn in array index space.
                ```python
                >>> import numpy as np
                >>> from cleopatra.glyphs.gridded.array_glyph import ArrayGlyph
                >>> arr = np.arange(25, dtype=float).reshape(5, 5)
                >>> glyph = ArrayGlyph(arr)
                >>> fig, ax = glyph.plot(kind="pcolormesh")  # doctest: +SKIP

                ```
            - `"contourf"` for filled contours. When `levels` is set
                the level edges line up with the colorbar boundaries.
                ```python
                >>> import numpy as np
                >>> from cleopatra.glyphs.gridded.array_glyph import ArrayGlyph
                >>> arr = np.arange(25, dtype=float).reshape(5, 5)
                >>> glyph = ArrayGlyph(arr)
                >>> fig, ax = glyph.plot(
                ...     kind="contourf", contour=Contour(levels=5)
                ... )  # doctest: +SKIP

                ```
            - Invalid kinds are rejected with a clear error:
                ```python
                >>> import numpy as np
                >>> from cleopatra.glyphs.gridded.array_glyph import ArrayGlyph
                >>> arr = np.arange(9, dtype=float).reshape(3, 3)
                >>> ArrayGlyph(arr).plot(kind="heatmap")
                Traceback (most recent call last):
                    ...
                ValueError: Invalid kind='heatmap'. Valid kinds are ('auto', 'imshow', 'pcolormesh', 'contour', 'contourf').

                ```

        - xarray-aligned colour kwargs:

            - `robust=True` clips `vmin` / `vmax` to the
                2nd/98th percentile so a single outlier no longer
                dominates the colour scale:
                ```python
                >>> import numpy as np
                >>> from cleopatra.glyphs.gridded.array_glyph import ArrayGlyph
                >>> data = np.arange(100, dtype=float).reshape(10, 10)
                >>> data[0, 0] = 1e6  # outlier
                >>> glyph = ArrayGlyph(data, robust=True)
                >>> fig, ax = glyph.plot(robust=True)  # doctest: +SKIP
                >>> round(glyph.vmin, 1), round(glyph.vmax, 1)
                (3.0, 98.0)

                ```
            - `center=0` symmetrises the limits around zero and
                auto-switches the cmap to `"RdBu_r"` (xarray-style
                diverging default):
                ```python
                >>> import numpy as np
                >>> from cleopatra.glyphs.gridded.array_glyph import ArrayGlyph
                >>> anomaly = np.linspace(-3.0, 8.0, 25).reshape(5, 5)
                >>> glyph = ArrayGlyph(anomaly, center=0.0)
                >>> fig, ax = glyph.plot(center=0.0)  # doctest: +SKIP
                >>> glyph.vmin, glyph.vmax
                (-8.0, 8.0)
                >>> glyph.default_options["cmap"]
                'RdBu_r'

                ```
            - `levels` discretises the colour scale and `extend`
                controls the colorbar arrows:
                ```python
                >>> import numpy as np
                >>> from cleopatra.glyphs.gridded.array_glyph import ArrayGlyph
                >>> arr = np.arange(25, dtype=float).reshape(5, 5)
                >>> glyph = ArrayGlyph(arr, extend="both")
                >>> fig, ax = glyph.plot(contour=Contour(levels=6))  # doctest: +SKIP
                >>> glyph.default_options["extend"]
                'both'

                ```
            - `cbar_kwargs` forwards extra keyword arguments to the
                underlying `matplotlib.pyplot.colorbar` call;
                user keys win on collision:
                ```python
                >>> import numpy as np
                >>> from cleopatra.glyphs.gridded.array_glyph import ArrayGlyph
                >>> arr = np.arange(9, dtype=float).reshape(3, 3)
                >>> glyph = ArrayGlyph(arr, cbar_kwargs={"shrink": 0.5})
                >>> fig, ax = glyph.plot()  # doctest: +SKIP
                >>> glyph.default_options["cbar_kwargs"]
                {'shrink': 0.5}

                ```
        """
        if kind not in VALID_PLOT_KINDS:
            raise ValueError(
                f"Invalid kind={kind!r}. Valid kinds are {VALID_PLOT_KINDS}."
            )
        if self.rgb and kind not in ("imshow", "auto"):
            raise ValueError(
                f"RGB compositing requires kind='imshow'. Got kind={kind!r}."
            )

        # Snapshot the pre-merge value of every option key these group objects
        # will touch, so an invalid `style` (validated below) can roll back the
        # WHOLE merge -- not just `style` -- and a co-passed color=/contour=/cells=
        # cannot leak into a later plain plot() on this (sticky-options) glyph.
        self._warn_norm_shadows_scale(color, kwargs.get("norm"))
        pre_group_opts = self._snapshot_group_options(
            color, contour, cells, classify, data_style
        )
        self._merge_group_params(color, contour, cells, classify, data_style)
        resolved_colorbar = self._apply_kwargs_and_colorbar(colorbar, kwargs)  # type: ignore[arg-type]

        self._validate_extend(self.default_options.get("extend"))

        self.default_options["kind"] = kind
        if kind == "auto":
            effective_kind = "pcolormesh" if self._coords is not None else "imshow"
        else:
            effective_kind = kind

        if ax is not None:
            self.ax = ax
            self.fig = _root_figure(ax)
            self._auto_figure = False
            self._owns_figure = False
        elif self.fig is None:
            self.fig, self.ax = self.create_figure_axes()
        elif self.ax is None:
            # A figure was bound without an axes: draw into the caller's figure
            # (its first axes, or a fresh one) rather than leaving self.ax None.
            self.ax = self.fig.axes[0] if self.fig.axes else self.fig.add_subplot(111)
            self._auto_figure = False
            self._owns_figure = False

        if title is not None:
            self.default_options["title"] = title

        arr = self.arr
        fig, ax = self.fig, self.ax

        style = self.default_options.get("style")
        if style is not None:
            try:
                resolve_single_layer_style(style)
            except ValueError:
                # Roll back the WHOLE merge to its pre-call snapshot -- every
                # key the group objects merged (style plus any co-passed
                # color=/contour=/cells=) -- so a failed styled plot never
                # leaks options into a later plain plot() on this glyph.
                for key, value in pre_group_opts.items():
                    self.default_options[key] = value
                raise
            if self.rgb:
                warnings.warn(
                    "data-style presets do not apply to RGB arrays; 'style' is "
                    "ignored and the RGB image is drawn as-is.",
                    stacklevel=2,
                )
            else:
                if points is not None or self.default_options.get("display_cell_value"):
                    warnings.warn(
                        "data-style presets bypass point and cell-value overlays; "
                        "'points' and 'display_cell_value' are ignored with 'style'.",
                        stacklevel=2,
                    )
                if self.default_options.get("scheme") is not None:
                    warnings.warn(
                        "a data-style preset owns the colour mapping, so 'classify' "
                        "is ignored with 'style'; drop 'data_style' to draw the "
                        "classified field.",
                        stacklevel=2,
                    )
                self._plot_with_style(style, compose=compose)
                if basemap is not None:
                    self._draw_basemap(basemap)
                if full_bleed:
                    self._apply_full_bleed(
                        facecolor=full_bleed if isinstance(full_bleed, str) else None
                    )
                elif getattr(self, "_auto_figure", False):
                    self._tighten_figure()
                return self.fig, self.ax

        if self.rgb:
            _clear_prior_render_artists(ax, self, compose=compose)
            extent = tuple(self.extent) if self.extent is not None else None
            self.im = ax.imshow(arr, extent=extent)
            self.cbar = None
        else:
            if "ticks_spacing" not in resolved_colorbar:
                if "ticks_spacing" in kwargs.keys():
                    self.default_options["ticks_spacing"] = kwargs["ticks_spacing"]
                else:
                    self.default_options["ticks_spacing"] = self.ticks_spacing

            recompute_keys = {"robust", "center", "vmin", "vmax"}
            if recompute_keys.intersection(kwargs.keys()):
                vmin_final, vmax_final = self._resolve_color_limits(
                    arr,
                    vmin_kw=kwargs.get("vmin"),
                    vmax_kw=kwargs.get("vmax"),
                    robust=bool(self.default_options.get("robust", False)),
                    center=self.default_options.get("center"),
                    vmin_explicit="vmin" in kwargs,
                    vmax_explicit="vmax" in kwargs,
                )
                self._vmin = vmin_final
                self._vmax = vmax_final
                if (
                    "ticks_spacing" not in kwargs
                    and "ticks_spacing" not in resolved_colorbar
                ):
                    self.ticks_spacing = (vmax_final - vmin_final) / 10 or 1.0
                    self.default_options["ticks_spacing"] = self.ticks_spacing

            if (
                "center" in kwargs
                and kwargs["center"] is not None
                and "cmap" not in kwargs
            ):
                self.default_options["cmap"] = DIVERGING_DEFAULT_CMAP

            self._vmin_explicit = self._vmin_explicit or "vmin" in kwargs
            self.default_options["vmin"] = self._log_floored_vmin(
                arr,
                self.vmin,
                vmin_pinned=self._vmin_explicit,
                ticks_spacing_pinned=(
                    "ticks_spacing" in kwargs or "ticks_spacing" in resolved_colorbar
                ),
            )
            self.default_options["vmax"] = self.vmax

            ticks = self.get_ticks()
            # Resolve the norm ONCE here, before any axes mutation: it surfaces a
            # bad `color_scale` / `scheme` (rolling the whole group merge back so
            # a failed classified plot leaves no half-applied option on this
            # sticky-options glyph), emits any scheme/scale conflict warning
            # exactly once with the caller's `plot(...)` as the attributed frame,
            # and is handed to the render site so classification (incl. the Jenks
            # DP) is not recomputed.
            try:
                norm, cbar_kw, ticks = self._norm_cbar_and_ticks(ticks)
            except (ValueError, TypeError):
                for key, value in pre_group_opts.items():
                    self.default_options[key] = value
                raise
            projection = self.default_options.get("projection")
            if projection and (
                self._coords is None
                or self._coords[0].ndim != 1
                or self._coords[1].ndim != 1
            ):
                raise ValueError(
                    "projection= requires 1-D lon/lat coordinate vectors (build "
                    "the glyph with coords=(lon, lat)); an extent-only or "
                    "2-D-coordinate array cannot be reprojected."
                )
            _clear_prior_render_artists(ax, self, compose=compose)
            if not compose:
                self._sync_projection_frame(projection_draws_frame(projection))
            if projection:
                if points is not None or self.default_options.get("display_cell_value"):
                    warnings.warn(
                        "'projection' draws point / cell-value overlays at raw grid "
                        "indices, not reprojected coordinates, so they are misplaced "
                        "under a projection; omit them when using 'projection'.",
                        stacklevel=2,
                    )
                if kind not in ("auto", "pcolormesh") or self.default_options.get(
                    "hillshade"
                ):
                    warnings.warn(
                        "'projection' always renders via pcolormesh and ignores "
                        "'kind' and 'hillshade'.",
                        stacklevel=2,
                    )
                im, cbar_kw = self._plot_projected(ax, arr, norm, cbar_kw, ticks)
            else:
                im, cbar_kw = self._plot_im_get_cbar_kw(
                    ax, arr, norm, cbar_kw, ticks, kind=effective_kind
                )
            self.im = im

            self.cbar = None
            degenerate_contour = (
                effective_kind == "contour" and self._vmax == self._vmin
            )
            unfilled_contourf = (
                effective_kind == "contourf"
                and self.default_options.get("fill") is False
            )
            if self._draws_own_colorbar(compose, colorbar):
                if degenerate_contour:
                    warnings.warn(
                        "Constant-value field has no contour lines; skipping "
                        "the colorbar for kind='contour'.",
                        stacklevel=2,
                    )
                elif unfilled_contourf:
                    # An unfilled (colors="none") set is not colour-mapped, so
                    # there is nothing to colorbar -- the hatch-overlay form.
                    # Warn only if the caller explicitly asked for one, so the
                    # dropped request is not silent.
                    if colorbar is not None or "add_colorbar" in getattr(
                        self,
                        "_render_explicit_options",
                        getattr(self, "_explicit_options", set()),
                    ):
                        warnings.warn(
                            "An unfilled contourf overlay (fill=False) is not "
                            "colour-mapped, so the requested colorbar is not "
                            "drawn.",
                            stacklevel=2,
                        )
                else:
                    self.cbar = self.create_color_bar(ax, im, cbar_kw)

        # A composed overlay must not retitle the host. This glyph's title is
        # empty unless it was given one, and setting that over the host's would
        # blank a caption the host put there.
        if not compose or self.default_options["title"]:
            ax.set_title(
                self.default_options["title"],
                fontsize=self.default_options["title_size"],
                pad=_multiline_title_pad(
                    ax,
                    self.default_options["title"],
                    self.default_options["title_size"],
                ),
            )
        # Row/column indices are meaningless axis labels, so a pixel-space
        # render hides them -- but only on an axes it owns. Composed onto a
        # host, stripping the host's ticks is not this overlay's call. Runs
        # before the axis styling so a caller's `xtick_font_size` is not applied
        # to ticks that are about to be deleted.
        if not compose and self.extent is None and effective_kind == "imshow":
            ax.set_xticklabels([])
            ax.set_yticklabels([])
            ax.set_xticks([])
            ax.set_yticks([])

        self._apply_axis_style(ax)

        supports_overlay = effective_kind in ("imshow", "pcolormesh")
        optional_display: dict[str, Any] = {}
        if self.default_options["display_cell_value"] and supports_overlay:
            indices = get_indices2(arr, [np.nan])
            optional_display["cell_text_value"] = self._plot_text(
                ax, arr, indices, self.default_options
            )

        if points is not None and supports_overlay:
            _, _, points_scatter, points_labels = points.draw(ax)
            optional_display["points_scatter"] = points_scatter
            optional_display["points_id"] = points_labels

        _mark_render_artists(
            ax,
            self,
            self.cbar,
            self.im,
            optional_display.get("points_scatter"),
            *(optional_display.get("points_id") or []),
            *(optional_display.get("cell_text_value") or []),
        )
        if basemap is not None:
            self._draw_basemap(basemap)
        if full_bleed:
            self._apply_full_bleed(
                facecolor=full_bleed if isinstance(full_bleed, str) else None
            )
        elif getattr(self, "_auto_figure", False):
            self._tighten_figure()
        return fig, ax

    def _facet_axes(
        self,
        nrows: int,
        ncols: int,
        figure_size: tuple[float, float] | None,
        axes: Any,
    ) -> tuple[Figure, np.ndarray, list[Axes], bool, bool]:
        """Resolve the figure and axes grid `facet` draws into.

        With `axes=None` a fresh figure is created and cleopatra owns it (it may
        re-lay-out and close it). Otherwise the panels are laid into the axes /
        host the caller supplied, the *root* `Figure` is returned, and cleopatra
        does not own it -- `facet` must not `tight_layout` or close it. The
        returned axes grid is always shape `(nrows, ncols)`, so `FacetGrid.axes`
        keeps its documented shape on every path.

        `created_axes` distinguishes the two non-owning paths: when cleopatra
        created the axes on a caller's host (`Figure` / `SubFigure` / grid spec)
        it can remove them again on failure, but when the caller supplied
        pre-existing axes it must leave them alone.

        Args:
            nrows: Number of grid rows.
            ncols: Number of grid columns.
            figure_size: `(width, height)` for the self-built figure; must be
                `None` when `axes` is supplied.
            axes: `None` (self-built), an `Axes` block (2-D `ndarray`, nested or
                flat sequence), a `Figure` / `SubFigure` host, or a `GridSpec` /
                `SubplotSpec` region to subdivide.

        Returns:
            tuple: `(fig, axes_grid, flat_axes, owns_figure, created_axes)` --
            the root figure, the `(nrows, ncols)` axes array for the
            `FacetGrid`, its row-major flattening the panel loop indexes,
            whether cleopatra owns the figure, and whether cleopatra created the
            axes (so a failure can undo them on a host but not on caller-owned
            pre-existing axes).

        Raises:
            ValueError: If `axes=` and `figure_size=` are both given, if a host
                grid spec has no figure or is too small, or if a supplied axes
                block is empty, holds non-`Axes` items, or does not reproduce
                the `(nrows, ncols)` grid.
        """
        if axes is None:
            if figure_size is None:
                figure_size = (4.0 * ncols, 3.5 * nrows)
            fig, grid = plt.subplots(
                nrows=nrows, ncols=ncols, figsize=figure_size, squeeze=False
            )
            return fig, grid, list(grid.ravel()), True, True

        if figure_size is not None:
            raise ValueError(
                "`axes=` and `figure_size=` are mutually exclusive: with `axes=` "
                "cleopatra draws into the axes you supply and never sizes a figure."
            )

        if isinstance(axes, (Figure, SubFigure)):
            grid = axes.subplots(nrows=nrows, ncols=ncols, squeeze=False)
            flat = list(grid.ravel())
            return _root_figure(flat[0]), grid, flat, False, True

        if isinstance(axes, (SubplotSpec, GridSpecBase)):
            fig, grid = self._facet_gridspec_grid(axes, nrows, ncols)
            return fig, grid, list(grid.ravel()), False, True

        fig, grid = self._facet_block_grid(axes, nrows, ncols)
        return fig, grid, list(grid.ravel()), False, False

    @staticmethod
    def _facet_gridspec_grid(
        axes: SubplotSpec | GridSpecBase, nrows: int, ncols: int
    ) -> tuple[Figure, np.ndarray]:
        """Create the panel grid on a `SubplotSpec` / grid-spec host.

        A `SubplotSpec` is subdivided into a fresh `nrows x ncols`
        `GridSpecFromSubplotSpec`; a `GridSpecBase` (a `GridSpec` or a
        `GridSpecFromSubplotSpec`) is used directly, and must be at least
        `nrows x ncols`. Either way a subplot is added per cell on the host
        figure.

        Args:
            axes: The `SubplotSpec` region or grid spec to lay panels into.
            nrows: Number of grid rows.
            ncols: Number of grid columns.

        Returns:
            tuple: `(root_figure, (nrows, ncols) axes array)`.

        Raises:
            ValueError: If the host is not attached to a figure, or a grid spec
                is smaller than `nrows x ncols`.
        """
        if isinstance(axes, SubplotSpec):
            host = axes.get_gridspec().figure
            if host is None:
                raise ValueError(
                    "the supplied SubplotSpec is not attached to a figure; build "
                    "its GridSpec with `GridSpec(..., figure=fig)`."
                )
            cells: SubplotSpec | GridSpecBase = GridSpecFromSubplotSpec(
                nrows, ncols, subplot_spec=axes
            )
        else:
            host = axes.figure
            if host is None:
                raise ValueError(
                    "the supplied grid spec is not attached to a figure; build it "
                    "with `GridSpec(..., figure=fig)`."
                )
            if axes.nrows < nrows or axes.ncols < ncols:
                raise ValueError(
                    f"the supplied grid spec is {axes.nrows}x{axes.ncols}, too "
                    f"small for a {nrows}x{ncols} facet grid."
                )
            cells = axes
        grid = np.empty((nrows, ncols), dtype=object)
        for r in range(nrows):
            for c in range(ncols):
                grid[r, c] = host.add_subplot(cells[r, c])
        return _root_figure(grid[0, 0]), grid

    @staticmethod
    def _facet_block_grid(
        axes: Any, nrows: int, ncols: int
    ) -> tuple[Figure, np.ndarray]:
        """Validate a supplied `Axes` block and shape it into the panel grid.

        The block must reproduce the facet's `(nrows, ncols)` grid so
        `FacetGrid.axes` keeps its documented shape and `col_wrap` is honoured:
        a 2-D `ndarray` must match exactly, a flat/nested block must hold
        `nrows*ncols` axes (the full grid, empty slots included, as the
        self-built `plt.subplots` path produces).

        Args:
            axes: A 2-D `ndarray`, or a nested/flat sequence of `Axes`.
            nrows: Number of grid rows.
            ncols: Number of grid columns.

        Returns:
            tuple: `(root_figure, (nrows, ncols) axes array)`.

        Raises:
            ValueError: If the block is empty, holds non-`Axes` items, or does
                not reproduce the `(nrows, ncols)` grid.
        """
        flat = _flatten_axes(axes)
        if not flat:
            raise ValueError("`axes=` is empty; supply at least one Axes.")
        if any(not isinstance(a, Axes) for a in flat):
            raise ValueError(
                "`axes=` must be matplotlib Axes (a 2-D array, or a nested or "
                "flat sequence of Axes), a Figure / SubFigure, or a GridSpec / "
                "SubplotSpec."
            )
        if isinstance(axes, np.ndarray) and axes.ndim == 2:
            if axes.shape != (nrows, ncols):
                raise ValueError(
                    f"`axes=` is a {axes.shape[0]}x{axes.shape[1]} block but the "
                    f"facet grid is {nrows}x{ncols}; supply a matching block."
                )
        elif len(flat) != nrows * ncols:
            raise ValueError(
                f"`axes=` supplies {len(flat)} axes but the facet grid is "
                f"{nrows}x{ncols} ({nrows * ncols} cells); supply exactly "
                f"{nrows * ncols}."
            )
        grid = _axes_grid_2d(axes, flat, nrows, ncols)
        return _root_figure(grid.ravel()[0]), grid

    def facet(
        self,
        layout: FacetLayout | None = None,
        *,
        kind: str = "auto",
        colorbar: bool | ColorBar | None = None,
        color: ColorScaling | Normalize | None = None,
        contour: Contour | None = None,
        cells: CellValues | None = None,
        classify: Classify | None = None,
        data_style: DataStyle | None = None,
        compose: bool = False,
        **kwargs,
    ) -> FacetGrid:
        """Render a grid of subplots from a 3-D or 4-D stack.

        Mirrors xarray's `xarray.plot.facetgrid.FacetGrid` API.
        `self.arr` must be 3-D `(N, H, W)` when only `col` is set,
        or 4-D `(N, M, H, W)` when both `col` and `row` are set.
        All subplots share a common colour scale (`vmin`/`vmax`
        computed over the full stack unless the user passed explicit
        limits); each panel draws its own colour legend on that shared
        scale (a colour bar, or a preset style's swatch -- see `colorbar=`
        below), and `result.cbar` exposes the first panel's bar when one
        is drawn.

        Spatial extent: every panel is a slice of the *same* array, so by
        default they all share the parent glyph's `extent` (one spatial
        domain — exactly like xarray's `FacetGrid`, which facets a single
        `DataArray` over a coordinate dimension). If your slices are
        same-shape grids covering *different* windows, pass `extents` —
        one `[xmin, ymin, xmax, ymax]` per panel. (If the slices are
        genuinely different datasets, build separate `ArrayGlyph`
        instances into your own `plt.subplots` grid instead.)

        Args:
            layout: The facet grid layout, as a `FacetLayout` (see that class
                for the full field list). Bundles which dimension(s) to facet
                (`col` / `row`), optional `col_wrap`, per-panel `labels`,
                per-panel `extents`, and the drawing target: either a self-built
                figure sized by `figure_size`, or caller-supplied `axes` (a 2-D
                `ndarray` of shape `(nrows, ncols)`, a nested / flat sequence of
                exactly `nrows * ncols` `Axes`, a `Figure` / `SubFigure` host, or
                a `GridSpec` / `SubplotSpec` region). `figure_size` and `axes`
                are mutually exclusive, and a supplied block must reproduce the
                `(nrows, ncols)` grid so `col_wrap` is honoured and
                `FacetGrid.axes` keeps that shape. With `axes` supplied cleopatra
                does not own the figure: it never `tight_layout`s or closes it,
                hides only the empty slots inside the block, and on a mid-render
                failure removes only the subplots it created on a host (a
                grid-spec host should be empty); caller-supplied pre-existing
                axes are left as they are, and plain matplotlib content on them
                is preserved. The shared colour scale and `FacetGrid.fig`
                (always the root `Figure`) are identical on every path.
            kind: Render kind, forwarded to the per-subplot dispatch.
                One of `"auto"`, `"imshow"`, `"pcolormesh"`,
                `"contour"`, `"contourf"`. Default `"auto"`.
            colorbar: The shared colour bar, mirroring `plot` / `animate`.
                `None` (default) keeps each panel's default colour legend --
                a colour bar, or a preset style's swatch -- (the prior
                behaviour); `False` suppresses them (`result.cbar` is then
                `None`);
                `True` draws default ones, resetting the resettable `cbar_*`
                family to defaults so they do not inherit a prior sticky
                spec; a `ColorBar` applies its
                placement / caption / sizing to every panel (so the
                `result.cbar` returned -- the first panel's -- carries the
                spec). Prefer this typed form over the loose `cbar_*`
                kwargs, here as on `plot` / `animate`.
            color: Colour-scale group object forwarded to each panel's `plot`
                (`cleopatra.styling.params.ColorScaling`).
            contour: Contour/discretisation group object forwarded to each
                panel's `plot` (`cleopatra.styling.params.Contour`).
            cells: Per-cell value-text group object forwarded to each panel's
                `plot` (`cleopatra.styling.params.CellValues`).
            classify: Value-classification group object
                (`cleopatra.styling.params.Classify`), by default `None`. A
                named scheme is resolved to its class edges **once over the
                whole stack**, so every panel shares one set of classes rather
                than re-binning its own slice; explicit edges are shared as-is.
            data_style: Named-preset / relief-shading group object forwarded to
                each panel's `plot` (`cleopatra.styling.params.DataStyle`).

            compose: Forwarded to each panel's `plot`. Controls what a panel
                does with a **prior cleopatra render** already on its axes:
                `False` (default) clears it first (the replace-don't-orphan
                behaviour of `plot`), `True` draws the panel *over* it. Only
                cleopatra-drawn layers are affected -- plain matplotlib content
                the caller added (a basemap, graticule or frame) is left in place
                either way -- so pass `compose=True` when the supplied axes
                already carry a cleopatra layer (e.g. a relief drawn via
                cleopatra) you want kept beneath the panel. Two consequences:
                (1) like `plot(compose=True)`, composing **suppresses the
                per-panel colorbar by default**, so `result.cbar` is `None`
                unless you also pass `colorbar=True` (or a `ColorBar` spec);
                (2) `compose=True` is only meaningful when there is a prior
                cleopatra layer to preserve -- on a self-built grid the axes are
                empty, so it just drops the colorbar for no benefit.
            **kwargs: Forwarded to each subplot. Recognised keys
                include the same colour / colorbar / level kwargs as
                `plot`. `vmin` / `vmax` win over the
                stack-wide auto-computed limits. Prefer the typed
                `colorbar` over the loose `cbar_*` kwargs.

        Returns:
            FacetGrid: Result object exposing `fig`, `axes`,
                `cbar`, and `name_dicts`.

        Raises:
            ValueError: If `layout` is omitted, if a layout keyword is passed
                loosely instead of on `FacetLayout` (e.g. `facet(col=...)`), if
                neither `layout.col` nor `layout.row` is given, if the array
                shape does not match the requested facet dimensions, if
                `layout.labels` lengths are wrong, if `layout.extents` is
                combined with the parent's `extent` / `coords` or has the wrong
                length or a non-length-4 element, or if a removed keyword is
                passed -- `figsize` or `col_coords` / `row_coords`. Also if
                `layout.figure_size` and `layout.axes` are both given, or
                `layout.axes` does not reproduce the `(nrows, ncols)` grid /
                holds non-`Axes` items / (for a grid-spec host) is not attached
                to a figure or is too small.

        Examples:
            - Facet a 3-D stack into a 1xN row of subplots:
                ```python
                >>> import numpy as np
                >>> from cleopatra.glyphs.gridded.array_glyph import (
                ...     ArrayGlyph,
                ...     FacetLayout,
                ... )
                >>> stack = np.arange(4 * 5 * 5, dtype=float).reshape(4, 5, 5)
                >>> g = ArrayGlyph(stack).facet(FacetLayout(col="t"))
                >>> g.axes.shape
                (1, 4)
                >>> g.name_dicts[0]
                {'t': 0}

                ```
            - Wrap N=6 panels into a 2x3 grid with `col_wrap=3`:
                ```python
                >>> import numpy as np
                >>> from cleopatra.glyphs.gridded.array_glyph import (
                ...     ArrayGlyph,
                ...     FacetLayout,
                ... )
                >>> stack = np.arange(6 * 5 * 5, dtype=float).reshape(6, 5, 5)
                >>> g = ArrayGlyph(stack).facet(FacetLayout(col="t", col_wrap=3))
                >>> g.axes.shape
                (2, 3)

                ```
            - Title each panel with a coordinate label via `PanelLabels`:
                ```python
                >>> import numpy as np
                >>> from cleopatra.glyphs.gridded.array_glyph import (
                ...     ArrayGlyph,
                ...     FacetLayout,
                ...     PanelLabels,
                ... )
                >>> stack = np.arange(3 * 5 * 5, dtype=float).reshape(3, 5, 5)
                >>> g = ArrayGlyph(stack).facet(
                ...     FacetLayout(
                ...         col="month",
                ...         labels=PanelLabels(col=["Jan", "Feb", "Mar"]),
                ...     )
                ... )
                >>> [d["month"] for d in g.name_dicts]
                ['Jan', 'Feb', 'Mar']

                ```
            - Per-panel extents for same-shape grids over different
                windows (one `[xmin, ymin, xmax, ymax]` per subplot):
                ```python
                >>> import numpy as np
                >>> from cleopatra.glyphs.gridded.array_glyph import (
                ...     ArrayGlyph,
                ...     FacetLayout,
                ... )
                >>> stack = np.arange(2 * 4 * 4, dtype=float).reshape(2, 4, 4)
                >>> g = ArrayGlyph(stack).facet(
                ...     FacetLayout(
                ...         col="region",
                ...         extents=[[0, 0, 10, 10], [10, 0, 20, 10]],
                ...     )
                ... )
                >>> [tuple(int(v) for v in im.get_extent()) for im in
                ...  (ax.get_images()[0] for ax in g.axes.flat)]
                [(0, 10, 0, 10), (10, 20, 0, 10)]

                ```
            - Configure the shared colour bar with a typed `ColorBar`:
                ```python
                >>> import numpy as np
                >>> from cleopatra.glyphs.gridded.array_glyph import (
                ...     ArrayGlyph,
                ...     FacetLayout,
                ... )
                >>> from cleopatra.styling.colorbar import ColorBar
                >>> stack = np.arange(3 * 5 * 5, dtype=float).reshape(3, 5, 5)
                >>> g = ArrayGlyph(stack).facet(
                ...     FacetLayout(col="t"), colorbar=ColorBar(label="mm")
                ... )
                >>> g.cbar.ax.get_ylabel()
                'mm'

                ```
            - Draw into axes the caller already created (and could decorate):
                ```python
                >>> import matplotlib.pyplot as plt
                >>> import numpy as np
                >>> from cleopatra.glyphs.gridded.array_glyph import (
                ...     ArrayGlyph,
                ...     FacetLayout,
                ... )
                >>> stack = np.arange(3 * 5 * 5, dtype=float).reshape(3, 5, 5)
                >>> fig, axs = plt.subplots(1, 3, figsize=(9, 3), squeeze=False)
                >>> g = ArrayGlyph(stack).facet(FacetLayout(col="t", axes=axs))
                >>> g.fig is fig
                True
                >>> g.axes[0, 0] is axs[0, 0]
                True
                >>> plt.close(fig)

                ```
        """
        if "figsize" in kwargs:
            raise ValueError(
                "`figsize` is not a valid `facet` argument; it was renamed to "
                "`figure_size`. Pass `figure_size=(width, height)` instead."
            )
        if "col_coords" in kwargs or "row_coords" in kwargs:
            raise ValueError(
                "`col_coords` / `row_coords` are no longer valid `facet` "
                "arguments; pass panel-title labels via "
                "`labels=PanelLabels(col=..., row=...)` instead."
            )
        moved = [k for k in _FACET_LAYOUT_KEYS if k in kwargs]
        if moved:
            raise ValueError(
                f"{', '.join(moved)} moved onto FacetLayout; pass "
                f"`facet(FacetLayout({moved[0]}=...), ...)` instead of a loose "
                f"`{moved[0]}=` keyword."
            )
        if layout is None:
            raise ValueError(
                "`facet` requires a `FacetLayout`, e.g. "
                "`facet(FacetLayout(col='time'))`."
            )

        col = layout.col
        row = layout.row
        col_wrap = layout.col_wrap
        labels = layout.labels
        figure_size = layout.figure_size
        axes = layout.axes
        extents = layout.extents

        if col is None and row is None:
            raise ValueError("at least one of `col`/`row` must be given")
        labels = labels or PanelLabels()
        if extents is not None:
            if self.extent is not None:
                raise ValueError(
                    "`extents` (per-panel) and the glyph's `extent` "
                    "(one shared domain) are mutually exclusive."
                )
            if self._coords is not None:
                raise ValueError("`extents` and `coords` are mutually exclusive.")
            for k, e in enumerate(extents):
                if len(e) != 4:
                    raise ValueError(
                        f"`extents[{k}]` must be a length-4 sequence "
                        f"[xmin, ymin, xmax, ymax], got {e!r}."
                    )

        arr = self.arr
        if row is None:
            if arr.ndim != 3:
                raise ValueError(
                    "Faceting on `col` alone requires a 3-D array "
                    f"(N, H, W); got shape {arr.shape}."
                )
            n_col = arr.shape[0]
            if col_wrap is not None:
                if not isinstance(col_wrap, (int, np.integer)) or col_wrap < 1:
                    raise ValueError(
                        f"`col_wrap` must be a positive int, got {col_wrap!r}."
                    )
                ncols = int(col_wrap)
                nrows = int(ceil(n_col / ncols))
            else:
                ncols = n_col
                nrows = 1
            labels.validate(n_col)
            panel_indices: list[tuple[int, int | None]] = [
                (i, None) for i in range(n_col)
            ]
            n_panels = n_col
        else:
            if col is None:
                raise ValueError("Faceting on `row` requires `col` as well.")
            if arr.ndim != 4:
                raise ValueError(
                    "Faceting on `row`+`col` requires a 4-D array "
                    f"(Ncol, Nrow, H, W); got shape {arr.shape}."
                )
            n_col, n_row = arr.shape[0], arr.shape[1]
            ncols = n_col
            nrows = n_row
            labels.validate(n_col, n_row)
            panel_indices = [(i, j) for j in range(n_row) for i in range(n_col)]
            n_panels = n_col * n_row

        if extents is not None and len(extents) != n_panels:
            raise ValueError(
                f"`extents` has {len(extents)} entries but there are {n_panels} panels."
            )

        col = cast(str, col)  # guaranteed non-None by the validation above

        # Resolve the classification edges ONCE over the whole stack, so every
        # panel shares one set of classes instead of re-binning its own slice.
        # A named scheme is turned into an explicit edge sequence (used verbatim
        # by `classify`); explicit edges and `"categorical"` (rejected per
        # panel) pass through unchanged. Done *before* the figure is created so a
        # raising scheme (e.g. an all-non-finite stack) never leaks a figure.
        shared_classify = classify
        if (
            classify is not None
            and isinstance(classify.scheme, str)
            and classify.scheme != "categorical"
        ):
            edges, _ = classify_values(
                self._scale_values(), classify.scheme, classify.k or 5
            )
            shared_classify = Classify(
                scheme=[float(e) for e in edges],
                category_legend_kwargs=classify.category_legend_kwargs,
            )

        fig, axes_grid, flat_axes, owns_figure, created_axes = self._facet_axes(
            nrows, ncols, figure_size, axes
        )

        vmin_user = kwargs.get("vmin")
        vmax_user = kwargs.get("vmax")
        if vmin_user is None or vmax_user is None:
            if isinstance(arr, ma.MaskedArray):
                finite = arr.compressed()
            else:
                finite = np.asarray(arr).ravel()
            finite = finite[np.isfinite(finite)]
            if finite.size == 0:
                stack_min = 0.0
                stack_max = 1.0
            else:
                stack_min = float(finite.min())
                stack_max = float(finite.max())
            shared_vmin = stack_min if vmin_user is None else float(vmin_user)
            shared_vmax = stack_max if vmax_user is None else float(vmax_user)
        else:
            shared_vmin = float(vmin_user)
            shared_vmax = float(vmax_user)

        per_subplot_kwargs = dict(kwargs)
        per_subplot_kwargs["vmin"] = shared_vmin
        per_subplot_kwargs["vmax"] = shared_vmax

        name_dicts: list[dict[str, Any]] = []
        cbar: Colorbar | None = None

        try:
            for panel_idx, (col_idx, row_idx) in enumerate(panel_indices):
                ax = flat_axes[panel_idx]
                if row is None:
                    panel_arr = arr[col_idx]
                else:
                    panel_arr = arr[col_idx, row_idx]

                if extents is not None:
                    sub_extent = list(extents[panel_idx])
                elif self.extent is None:
                    sub_extent = None
                else:
                    sub_extent = [
                        self.extent[0],  # xmin
                        self.extent[2],  # ymin
                        self.extent[1],  # xmax
                        self.extent[3],  # ymax
                    ]
                sub = ArrayGlyph(
                    panel_arr,
                    coords=self._coords,
                    extent=sub_extent,
                    fig=fig,
                    ax=ax,
                    **per_subplot_kwargs,
                )
                # Route `colorbar=` through `plot` (not the constructor) so the
                # shared `_apply_kwargs_and_colorbar` logic runs per panel -- it
                # merges the resolved spec *over* any loose `cbar_*` already folded
                # into the sub-glyph's options and sets `_style_wants_colorbar`, so
                # a placement-bearing colorbar overrides a preset swatch here just
                # as it does on `plot` / `animate`.
                sub.plot(
                    kind=kind,
                    colorbar=colorbar,
                    color=color,
                    contour=contour,
                    cells=cells,
                    classify=shared_classify,
                    data_style=data_style,
                    compose=compose,
                )

                title, name_dict = labels.panel_title(col, col_idx, row, row_idx)
                ax.set_title(title)
                name_dicts.append(name_dict)

                if panel_idx == 0 and getattr(sub, "cbar", None) is not None:
                    cbar = sub.cbar

            # Hide the empty slots -- only the ones inside the block we drew into
            # (every axis beyond the rendered panels), never the host's others.
            for hidden_ax in flat_axes[n_panels:]:
                hidden_ax.set_visible(False)

            # Only re-lay-out a figure cleopatra created; a caller's figure is
            # theirs to arrange.
            if owns_figure:
                fig.tight_layout()
        except Exception:
            # Roll back what cleopatra created: close a figure it owns; on a
            # caller's host, remove the subplots it added (but never touch
            # pre-existing axes the caller supplied).
            if owns_figure:
                plt.close(fig)
            elif created_axes:
                for panel_ax in flat_axes:
                    panel_ax.remove()
            raise
        result = FacetGrid(fig=fig, axes=axes_grid, cbar=cbar, name_dicts=name_dicts)
        return result

    def _apply_full_bleed(self, facecolor: str | None = None) -> None:
        """Give the axes the whole figure, chrome-free (for `full_bleed=...`).

        Hides ticks and spines, resizes the figure so its aspect matches the
        georeferenced data box (from `extent`) so the map fills the frame
        without distortion, then hands the axes the entire figure area
        (`set_position([0, 0, 1, 1])`, `aspect="auto"`). Without an `extent` the
        aspect is unknown, so the axes still fills but may stretch. The caller
        skips its `tight_layout` when this runs.

        The canvas colour is left untouched unless `facecolor` is given -- so
        masked / no-data cells keep the default background, not black. Pass a
        `facecolor` (e.g. `"black"`) only when the backdrop should be painted,
        e.g. so a semi-transparent relief reads dark.

        Args:
            facecolor: Optional axes + figure background colour. `None`
                (default) leaves the canvas unchanged.
        """
        ax, fig = self.ax, self.fig
        if self.extent is not None:
            xmin, xmax, ymin, ymax = self.extent
            width, height = abs(xmax - xmin), abs(ymax - ymin)
            if width > 0 and height > 0:
                fig_width = fig.get_size_inches()[0]
                fig.set_size_inches(fig_width, fig_width * height / width, forward=True)
        ax.set_xticks([])
        ax.set_yticks([])
        for spine in ax.spines.values():
            spine.set_visible(False)
        if facecolor is not None:
            ax.set_facecolor(facecolor)
            fig.patch.set_facecolor(facecolor)
        ax.set_aspect("auto")
        ax.set_position([0, 0, 1, 1])

    def animate(
        self,
        time: list[Any],
        points: PointOverlay | None = None,
        *,
        playback: Animation | None = None,
        color: ColorScaling | Normalize | None = None,
        contour: Contour | None = None,
        cells: CellValues | None = None,
        classify: Classify | None = None,
        data_style: DataStyle | None = None,
        full_bleed: bool | str = False,
        basemap: bool | dict | Basemap | Callable[[Any], None] | None = None,
        colorbar: bool | ColorBar | None = None,
        compose: bool = False,
        **kwargs: Unpack[AnimateKwargs],
    ) -> FuncAnimation:
        """Create an animation from a single-band or true-colour stack.

        This method creates an animation by iterating the first axis of the
        data, turning each slice into a frame with optional time labels, point
        annotations, and cell-value displays. Two stack layouts are accepted:

        - a 3-D `(time, rows, cols)` single-band stack, rendered as a
          colormapped field with a colorbar (the historical behaviour); and
        - a 4-D `(time, rows, cols, 3|4)` RGB / RGBA stack, where each frame is
          drawn straight through `imshow` as true colour — no norm, colormap or
          colorbar (`self.cbar` is left `None`), and `display_cell_value` is
          ignored because per-cell annotation needs a scalar field. RGB/RGBA
          frames must be display-ready (floats in `[0, 1]` or `uint8` in
          `[0, 255]`, as produced by `prepare_array`); out-of-range values are
          clipped by matplotlib.

        Every frame shares the glyph's single `extent` (one spatial domain) —
        there is no per-frame extent. For data spanning different domains, build
        one `ArrayGlyph` per domain instead of stacking them.

        Args:
            time: A list containing labels for each frame in the animation.
                These could be timestamps, frame numbers, or any other identifiers.
                The length of this list should match the first dimension of the array.
            points: Points to display on the array, by default None. A
                `PointOverlay` bundling the `(N, 3)` array of
                `[value, row, col]` per point together with the marker /
                value-label styling (`color` / `size` / `label_color` /
                `label_size`).
            playback: Animation-specific options as an
                `cleopatra.glyphs.gridded.array_glyph.Animation`, by default
                `None` (all defaults). Bundles `interval` (frame delay, ms),
                `frame_label` (a `FrameLabel` for the per-frame time label),
                `cell_value_text_colors` (the low/high cell-value text colours),
                and `data_getter` (a lazy `f(i) -> ndarray` frame source). The
                render / colour options below stay their own arguments.
            color: Colour-scale group object
                (`cleopatra.styling.scaling.ColorScaling`), e.g.
                `ColorScaling.power(gamma=0.7)`. Replaces the loose
                `color_scale` / `gamma` / `line_threshold` / `line_scale` /
                `bounds` / `midpoint` keywords.
            contour: Discretisation group object
                (`cleopatra.styling.params.Contour`), e.g.
                `Contour(levels=5)`, to bin the colour scale into a
                `BoundaryNorm` for the animation (an animation has no
                `contour`/`contourf` kind, so only `levels` applies here).
            cells: Per-cell value-text group object
                (`cleopatra.styling.params.CellValues`), e.g.
                `CellValues(show=True, size=8)`. Replaces the loose
                `display_cell_value` / `num_size` /
                `background_color_threshold` keywords. (`precision` remains an
                explicit parameter; the cell-value text colours moved onto
                `playback=Animation(cell_value_text_colors=...)`.)
            classify: Value-classification group object
                (`cleopatra.styling.params.Classify`), by default `None`
                (a continuous colour scale). Bins the stack's finite cells into
                discrete colour classes with a stepped colorbar, e.g.
                `Classify(scheme="quantiles", k=5)`. The class edges are resolved
                **once over the whole stack**, so every frame shares one set of
                classes. `scheme="categorical"` is rejected for a raster.
            data_style: Named-preset / relief-shading group object
                (`cleopatra.styling.params.DataStyle`), e.g.
                `DataStyle(style="dem", hillshade=True)` or
                `DataStyle(style="temperature_2m", bands=6, alpha=0.5)`.
                Replaces the loose `style` / `hillshade` keywords and the
                per-call preset overrides `bands` / `alpha` / `alpha_range`.
            full_bleed: Fill the whole figure edge-to-edge with no chrome, by
                default False. `True` hides ticks and spines, resizes the figure
                so its aspect matches the georeferenced data box (from `extent`,
                so the fill introduces no distortion), and gives the axes the
                entire figure area (`set_position([0, 0, 1, 1])`,
                `aspect="auto"`); the internal `tight_layout` is skipped. The
                canvas colour is left untouched, so masked / no-data cells keep
                the default background rather than turning black. Pass a colour
                string instead (e.g. `"black"`) to also paint the canvas that
                colour -- e.g. so a semi-transparent relief backdrop reads dark.
                Intended for chrome-free maps -- a colorbar or title has no room,
                so pair it with `add_colorbar=False` (and no `title`). Without an
                `extent` the axes still fills the figure but may stretch.
            basemap: A reference backdrop drawn via the glyph's own
                `add_relief` / `add_features` and composed with the frames by
                `zorder` (relief under the data, coastline/borders over it), by
                default None (no basemap). Accepts ``True`` for a sensible
                default (a `"low"` relief plus grey `"50m"` coastline and
                borders), a `Basemap` (the typed, validated form -- `relief` /
                `features` / `resolution` / `check_alignment`, with `features`
                taking `Feature` objects), a **dict** with the same keys (see
                `GeoMixin._draw_basemap`), or a **callable** ``f(glyph)`` for
                full control. On a value-linked-opacity `style` (e.g.
                `temperature_flame`) the cool areas reveal the terrain while the
                data glows on top. Drawing the relief needs the `[tiles]` extra
                (Pillow).
            colorbar: Colorbar presence and placement. `None` (default) keeps
                matplotlib's placement (honouring the legacy `add_colorbar`);
                `False` draws no colorbar; `True` a default one. Pass a
                `ColorBar` for control -- an edge (`location`), an `inside`
                inset that tracks `full_bleed`, a backing `box` (defaulted on
                for an inset), and text colours (`label_color` for the title,
                `tick_color` for the tick numbers). Same flag as `plot(colorbar=)`.
                On a `style=` preset, a placement `ColorBar` (or `True`) overrides
                the swatch with a real colorbar; a colours-only `ColorBar` styles
                the swatch in place (defaults < preset < explicit).
            compose: Draw *over* whatever is already on `ax` instead of
                replacing it, leaving another glyph's layers, colorbar, title
                and ticks intact. Off by default, where a render replaces every
                glyph's artists on the axes (see issue #210). Same flag as
                `plot(compose=)`, including the colorbar default: a composed
                animation draws none of its own unless the caller asks with
                `colorbar=` or `add_colorbar=True`, so the host keeps the
                geometry it had.
            **kwargs: Additional keyword arguments for customizing the animation.

                Plot appearance:
                    title : str, optional
                        Title of the plot, by default 'Array Plot'.
                    title_size : int, optional
                        Title font size, by default 15.
                    cmap : str or matplotlib.colors.Colormap, optional
                        Colormap, by default 'coolwarm_r'. A plain matplotlib
                        name (e.g. 'viridis') or a `Colormap` object is used
                        as-is; a **namespaced** name such as 'cmocean:thermal'
                        or 'cmasher:ember' is resolved via the optional `cmap`
                        aggregator — install the `[science-colors]` extra
                        (`pip install cleopatra[science-colors]`). The `_r`
                        reverse suffix works on both forms.
                    vmin : float, optional
                        Minimum value for color scaling, by default min(array).
                    vmax : float, optional
                        Maximum value for color scaling, by default max(array).

                Color bar options:
                    add_colorbar : bool, optional
                        Whether to draw the glyph's own color bar, by
                        default True -- except under `compose=True`, which
                        defaults it off so the animation does not take space
                        from the host axes; passing it there (`True` or
                        `False`) still decides the matter. With it off
                        `self.cbar` stays None, no axes space is taken by a
                        color bar, and the mappable is still reachable via
                        `self.im`.
                    cbar_orientation : str, optional
                        Prefer `colorbar=ColorBar(orientation=...)`.
                        Orientation of the color bar, by default 'vertical'.
                        Can be 'horizontal' or 'vertical'.
                    cbar_label_rotation : float, optional
                        Prefer `colorbar=ColorBar(label_rotation=...)`.
                        Rotation angle (degrees) of the color bar label, by
                        default None (matplotlib's own label orientation).
                    cbar_label_location : str, optional
                        Prefer `colorbar=ColorBar(label_location=...)`.
                        Location of the color bar label, by default 'center'.
                        Valid values depend on the bar orientation -- vertical:
                        'top'/'center'/'bottom'; horizontal: 'left'/'center'/'right'.
                    cbar_length : float, optional
                        Prefer `colorbar=ColorBar(length=...)`. Ratio to
                        control the height/width of the color bar, by default 0.75.
                    ticks_spacing : int, optional
                        Prefer `colorbar=ColorBar(ticks_spacing=...)`.
                        Spacing between ticks on the color bar, by default 5.
                    cbar_label_size : int, optional
                        Prefer `colorbar=ColorBar(label_size=...)`. Font
                        size of the color bar label, by default 12.
                    cbar_label : str, optional
                        Prefer `colorbar=ColorBar(label=...)`. Label text
                        for the color bar, by default None.

                Grouped options (moved off `**kwargs`):
                    The colour-scale options (`color_scale`, `gamma`,
                    `line_threshold`, `line_scale`, `bounds`, `midpoint`)
                    move to `color=ColorScaling(...)`; the per-cell value
                    text (`display_cell_value`, `num_size`,
                    `background_color_threshold`) moves to
                    `cells=CellValues(...)`; the named preset and relief
                    shading (`style`, `hillshade`) move to
                    `data_style=DataStyle(...)`. See
                    `cleopatra.styling.scaling.ColorScaling` and
                    `cleopatra.styling.params`. Passing any of them as a
                    loose keyword raises with a pointer to the object.

                    precision : int, optional
                        Decimal places each frame's cell value text is
                        rounded to, by default 2. `animate`-only, and still
                        a loose keyword (not part of `CellValues`).

        Returns:
            matplotlib.animation.FuncAnimation: The animation object that can be displayed
                in a notebook or saved to a file.

            As with `plot`, the first-frame colour-mapped artist is stored on
            the instance as `self.im` (and the colorbar, when drawn, on
            `self.cbar`), so a caller can attach a host-owned
            colorbar/legend without scraping the axes.

        Raises:
            ValueError: If an invalid keyword argument is provided.
            ValueError: If the length of the time list doesn't match the first dimension of the array.
            ValueError: If `data_getter` is None and `self.arr` is
                neither a 3-D `(time, rows, cols)` nor a 4-D
                `(time, rows, cols, 3|4)` array (no time axis to
                iterate over).
            ValueError: If `data_getter` is set and a returned frame's
                spatial dims do not match `self.arr.shape[-2:]`.

        Notes:
            The animation is created by iterating through the first dimension of the array.
            For example, if the array has shape (10, 20, 30), the animation will have 10 frames,
            each showing a 20x30 slice of the array.

            This method does not call `plt.show()`; it returns the `FuncAnimation` so the
            caller controls display. In an interactive (non-notebook) session call
            `plt.show()` yourself to play it, or use `save_animation` to write it to a file.

            To display the animation in a Jupyter notebook, you may need to use:
            ```python
            from IPython.display import HTML
            HTML(anim_obj.to_jshtml())
            ```

            To save the animation to a file, use the `save_animation` method after creating
            the animation.

        Examples:
        Basic animation from a 3D array:
        ```python
        >>> import numpy as np
        >>> from cleopatra.glyphs.gridded.array_glyph import ArrayGlyph
        >>> # Create a 3D array with 5 frames, each 10x10
        >>> arr = np.random.randint(1, 10, size=(5, 10, 10))
        >>> # Create labels for each frame
        >>> frame_labels = ["Frame 1", "Frame 2", "Frame 3", "Frame 4", "Frame 5"]
        >>> # Create the ArrayGlyph object
        >>> animated_array = ArrayGlyph(arr, figsize=(8, 8), title="Animated Array")
        >>> # Create the animation
        >>> anim_obj = animated_array.animate(frame_labels)

        ```
        Animation with custom interval (speed):
        ```python
        >>> animated_array = ArrayGlyph(arr, figsize=(8, 8), title="Animated Array")
        >>> # Slower animation (500ms between frames)
        >>> anim_obj = animated_array.animate(frame_labels, playback=Animation(interval=500))
        >>> animated_array = ArrayGlyph(arr, figsize=(8, 8), title="Animated Array")
        >>> # Faster animation (100ms between frames)
        >>> anim_obj = animated_array.animate(frame_labels, playback=Animation(interval=100))

        ```
        Animation with points:
        ```python
        >>> # Create a styled point overlay to display on the animation
        >>> from cleopatra.glyphs.gridded.array_glyph import PointOverlay
        >>> overlay = PointOverlay(
        ...     np.array([[1, 2, 3], [2, 5, 5], [3, 8, 8]]),
        ...     color="black",
        ...     size=150,
        ...     label_color="white",
        ...     label_size=12,
        ... )
        >>> animated_array = ArrayGlyph(arr, figsize=(8, 8), title="Animated Array")
        >>> anim_obj = animated_array.animate(frame_labels, points=overlay)

        ```
        Animation with cell values displayed:
        ```python
        >>> animated_array = ArrayGlyph(arr, figsize=(8, 8), title="Animated Array")
        >>> anim_obj = animated_array.animate(
        ...     frame_labels,
        ...     cells=CellValues(show=True, size=10),
        ...     playback=Animation(cell_value_text_colors=("yellow", "blue")),
        ... )

        ```
        ![animated_array](./../images/array_glyph/animated_array.gif)

        Saving the animation to a file:
        ```python
        >>> # Create the animation first
        >>> animated_array = ArrayGlyph(arr, figsize=(8, 8), title="Animated Array")
        >>> anim_obj = animated_array.animate(frame_labels)
        >>> # Then save it to a file
        >>> animated_array.save_animation("animation.gif", fps=2)

        ```
        Lazy frame streaming via `data_getter` (the callback supplies
        frame `i` on demand — useful for NetCDF time slabs or any
        source where eager loading is too expensive). The data array
        on the glyph acts as a shape template; only its last two axes
        are read.
        ```python
        >>> import numpy as np
        >>> from cleopatra.glyphs.gridded.array_glyph import ArrayGlyph
        >>> template = np.arange(36, dtype=float).reshape(1, 6, 6)
        >>> glyph = ArrayGlyph(template, figsize=(4, 4), title="Lazy")
        >>> labels = ["t0", "t1", "t2"]
        >>> def get_frame(i):
        ...     return np.full((6, 6), float(i)) + np.arange(36).reshape(6, 6)
        >>> anim_obj = glyph.animate(labels, playback=Animation(data_getter=get_frame))
        >>> anim_obj._fig is glyph.fig
        True

        ```
        True-colour animation from a 4-D `(time, rows, cols, 3)` RGB stack.
        Each frame is drawn as true colour, so no colorbar is created
        (`glyph.cbar` stays `None`):
        ```python
        >>> import numpy as np
        >>> from cleopatra.glyphs.gridded.array_glyph import ArrayGlyph
        >>> rgb_stack = np.linspace(0.0, 1.0, 3 * 6 * 6 * 3).reshape(3, 6, 6, 3)
        >>> glyph = ArrayGlyph(rgb_stack, figsize=(4, 4), title="RGB")
        >>> anim_obj = glyph.animate(["t0", "t1", "t2"])
        >>> glyph.cbar is None
        True

        ```
        Full-bleed layout: no chrome (ticks/spines) and the axes taking the whole
        figure. `full_bleed=True` leaves the canvas colour alone; pass a colour
        (`full_bleed="black"`) to also paint it, so masked cells read dark:
        ```python
        >>> import numpy as np
        >>> from cleopatra.glyphs.gridded.array_glyph import ArrayGlyph
        >>> stack = np.arange(3 * 6 * 8, dtype=float).reshape(3, 6, 8)
        >>> glyph = ArrayGlyph(stack, extent=[0, 0, 8, 6])
        >>> anim_obj = glyph.animate(
        ...     ["t0", "t1", "t2"], full_bleed="black", add_colorbar=False
        ... )
        >>> tuple(round(float(v), 3) for v in glyph.ax.get_position().bounds)
        (0.0, 0.0, 1.0, 1.0)
        >>> glyph.ax.get_facecolor()
        (0.0, 0.0, 0.0, 1.0)

        ```
        Compose a reference basemap under the frames (`basemap=True`) -- relief
        below, coastline and borders over. The `animate` call is `+SKIP`ped in
        doctest because it downloads the `[tiles]` assets on first use:
        ```python
        >>> import numpy as np
        >>> from cleopatra.glyphs.gridded.array_glyph import ArrayGlyph
        >>> stack = np.arange(3 * 20 * 30, dtype=float).reshape(3, 20, 30)
        >>> glyph = ArrayGlyph(stack, extent=[-12, 34, 32, 64])
        >>> anim_obj = glyph.animate(  # doctest: +SKIP
        ...     ["t0", "t1", "t2"], basemap=True, full_bleed=True, add_colorbar=False
        ... )

        ```
        """
        playback = playback or Animation()
        cell_value_text_colors = playback.cell_value_text_colors
        interval = playback.interval
        data_getter = playback.data_getter
        frame_label = playback.frame_label or FrameLabel()

        self._warn_norm_shadows_scale(color, kwargs.get("norm"))
        pre_group_opts = self._snapshot_group_options(
            color, contour, cells, classify, data_style
        )
        self._merge_group_params(color, contour, cells, classify, data_style)
        resolved_colorbar = self._apply_kwargs_and_colorbar(colorbar, kwargs)  # type: ignore[arg-type]

        if "ticks_spacing" not in resolved_colorbar:
            if "ticks_spacing" in kwargs.keys():
                self.default_options["ticks_spacing"] = kwargs["ticks_spacing"]
            else:
                self.default_options["ticks_spacing"] = self.ticks_spacing

        self._vmin_explicit = self._vmin_explicit or "vmin" in kwargs
        if "vmin" in kwargs.keys():
            self.default_options["vmin"] = kwargs["vmin"]
        else:
            self.default_options["vmin"] = self._log_floored_vmin(
                self.arr,
                self.vmin,
                vmin_pinned=self._vmin_explicit,
                ticks_spacing_pinned=(
                    "ticks_spacing" in kwargs or "ticks_spacing" in resolved_colorbar
                ),
            )

        if "vmax" in kwargs.keys():
            self.default_options["vmax"] = kwargs["vmax"]
        else:
            self.default_options["vmax"] = self.vmax

        precision = self.default_options["precision"]
        array = self.arr

        def _is_rgb_frame(frame: np.ndarray) -> bool:
            return frame.ndim == 3 and frame.shape[-1] in (3, 4)

        if data_getter is None:
            if array.ndim == 4 and array.shape[-1] in (3, 4):
                # 4-D true-colour stack: (time, rows, cols, 3|4).
                frame_0 = array[0]
                n_frames = array.shape[0]
            elif array.ndim == 3:
                # 3-D single-band stack: (time, rows, cols).
                frame_0 = array[0, :, :]
                n_frames = array.shape[0]
            else:
                raise ValueError(
                    "animate requires a 3-D (time, rows, cols) or 4-D "
                    "(time, rows, cols, 3|4) array, or a data_getter callback"
                )
        else:
            n_frames = len(time)
            frame_0 = np.asarray(data_getter(0))
            expected_hw = tuple(array.shape[-2:])
            actual_hw = frame_0.shape[:2] if _is_rgb_frame(frame_0) else frame_0.shape
            if actual_hw != expected_hw:
                raise ValueError(
                    f"`data_getter` returned shape {frame_0.shape}, whose "
                    f"spatial dims {actual_hw} do not match the data array's "
                    f"last two axes {expected_hw}."
                )

        rgb_frames = _is_rgb_frame(frame_0)
        show_cell_value = self.default_options["display_cell_value"] and not rgb_frames

        if self.fig is None:
            self.fig, self.ax = self.create_figure_axes()
        elif self.ax is None:
            # A figure was bound without an axes: draw into the caller's figure.
            self.ax = self.fig.axes[0] if self.fig.axes else self.fig.add_subplot(111)
            self._auto_figure = False
            self._owns_figure = False

        fig, ax = self.fig, self.ax

        style_render: Any = None
        style_categorical = False

        if rgb_frames:
            _clear_prior_render_artists(ax, self, compose=compose)
            im = ax.imshow(frame_0, extent=self.extent)
            self.im = im
            self.cbar = None
        else:
            ticks = self.get_ticks()
            # Resolve the norm ONCE here, before any axes mutation: it surfaces a
            # bad `color_scale` / `scheme` (rolling the group merge back so a
            # failed classified animation leaves no half-applied option), emits
            # any scheme/scale conflict warning exactly once attributed to the
            # caller's `animate(...)`, and is handed to the render site so
            # classification is not recomputed. A named scheme bins the whole
            # stack (`_scale_values`), so every frame shares one set of classes.
            try:
                norm, cbar_kw, ticks = self._norm_cbar_and_ticks(ticks)
            except (ValueError, TypeError):
                for key, value in pre_group_opts.items():
                    self.default_options[key] = value
                raise
            _clear_prior_render_artists(ax, self, compose=compose)
            im, cbar_kw = self._plot_im_get_cbar_kw(ax, frame_0, norm, cbar_kw, ticks)
            self.im = im

            self.cbar = None
            if self._draws_own_colorbar(compose, colorbar):
                self.cbar = self.create_color_bar(ax, im, cbar_kw)

            frame_0_scalar = np.asarray(
                ma.filled(ma.asarray(frame_0).astype(float), np.nan), dtype=float
            )
            style = self.default_options.get("style")
            if style is not None:
                if points is not None or show_cell_value:
                    warnings.warn(
                        "data-style presets bypass point and cell-value "
                        "overlays; 'points' and 'display_cell_value' are ignored "
                        "with 'style'.",
                        stacklevel=2,
                    )
                    points = None
                    show_cell_value = False
                if self.default_options.get("scheme") is not None:
                    warnings.warn(
                        "a data-style preset owns the colour mapping, so 'classify' "
                        "is ignored with 'style'; drop 'data_style' to draw the "
                        "classified field.",
                        stacklevel=2,
                    )
                layer = self._resolve_style_layer(style)
                cfg = {
                    **DATA_STYLES[style][layer],
                    **resolve_style_overrides(self._style_color_overrides),
                }
                self._apply_style_background(cfg)
                hillshade_active = (
                    resolve_hillshade(self.default_options.get("hillshade")) is not None
                )
                categories = cfg.get("categories")
                if categories is not None:
                    style_categorical = True
                    if hillshade_active:
                        warnings.warn(
                            "hillshade is not composed with a categorical "
                            "data-style preset; the preset is applied and "
                            "hillshade ignored.",
                            stacklevel=2,
                        )
                    cats = sorted(categories, key=lambda c: c[0])
                    cat_values = np.array([float(c[0]) for c in cats])
                    cat_colors = [c[1] for c in cats]
                    cat_labels = [c[2] for c in cats]
                    cat_cmap = ListedColormap(cat_colors)
                    cat_norm = BoundaryNorm(
                        category_boundaries(list(cat_values)), len(cat_colors)
                    )
                    if self.cbar is not None:
                        self.cbar.remove()
                        self.cbar = None
                    im.set_data(frame_0_scalar)
                    im.set_cmap(cat_cmap)
                    im.set_norm(cat_norm)
                    if self._draws_own_colorbar(compose, colorbar):
                        disjoint_legend(
                            ax,
                            cat_colors,
                            cat_labels,
                            title=cfg["label"],
                            loc="upper right",
                        )
                    style_render = ("categorical", cat_cmap, cat_norm, cat_values)
                else:
                    stack = array if data_getter is None else frame_0
                    style_norm, style_vmin, style_vmax = resolve_style_norm(
                        np.asarray(
                            ma.filled(ma.asarray(stack).astype(float), np.nan),
                            dtype=float,
                        ),
                        cfg,
                    )
                    style_cmap = resolve_colormap(cfg["cmap"])
                    im.set_data(frame_0_scalar)
                    im.set_cmap(style_cmap)
                    im.set_norm(style_norm)
                    if self.cbar is not None:
                        self.cbar.remove()
                        self.cbar = None
                    if self._style_wants_colorbar:
                        insets = list(ax.child_axes)
                        for _inset in insets:
                            _inset.remove()
                        mappable = ScalarMappable(norm=style_norm, cmap=style_cmap)
                        mappable.set_array([])
                        self.cbar = self.create_color_bar(
                            ax, mappable, self._style_cbar_kw(style_norm)
                        )
                    elif self._draws_own_colorbar(compose, colorbar):
                        insets = list(ax.child_axes)
                        for _inset in insets:
                            _inset.remove()
                        vmin_prefix, vmax_prefix = swatch_extend_prefixes(style_norm)
                        swatch_legend(
                            ax,
                            style_cmap,
                            cfg["label"],
                            vmin=style_vmin,
                            vmax=style_vmax,
                            norm=style_norm,
                            vmin_prefix=vmin_prefix,
                            vmax_prefix=vmax_prefix,
                            bounds=(0.02, 0.92, 0.32, 0.06),
                            text_color=self.default_options.get("cbar_label_color")
                            or _swatch_text_default(
                                self.default_options.get("cbar_box")
                            ),
                            value_color=self.default_options.get("cbar_tick_color")
                            or _swatch_text_default(
                                self.default_options.get("cbar_box")
                            ),
                            box=self.default_options.get("cbar_box"),
                        )
                    alpha_vmin = cfg.get("alpha_vmin")
                    alpha_vmax = cfg.get("alpha_vmax")
                    style_alpha_norm = (
                        Normalize(vmin=alpha_vmin, vmax=alpha_vmax)
                        if alpha_vmin is not None or alpha_vmax is not None
                        else None
                    )
                    style_render = (
                        "continuous",
                        style_cmap,
                        style_norm,
                        style_alpha_norm,
                        cfg.get("alpha"),
                    )

        # A composed animation adds a layer to someone else's axes: retitling it
        # or stripping its ticks is the host's business, not ours.
        if not compose or self.default_options["title"]:
            ax.set_title(
                self.default_options["title"],
                fontsize=self.default_options["title_size"],
                pad=_multiline_title_pad(
                    ax,
                    self.default_options["title"],
                    self.default_options["title_size"],
                ),
            )
        # Row/column indices are meaningless axis labels, so a pixel-space
        # animation hides them -- the same rule `plot` applies. An animation
        # given an `extent` has real coordinates to show, and until now had them
        # blanked anyway, which quietly made `xtick_font_size` and
        # `ytick_font_size` inert on this path.
        if not compose and self.extent is None:
            ax.set_xticklabels([])
            ax.set_yticklabels([])

            ax.set_xticks([])
            ax.set_yticks([])

        self._apply_axis_style(ax)

        cell_text_value: list = []
        if show_cell_value:
            indices = get_indices2(frame_0, [np.nan])
            cell_text_value = self._plot_text(
                ax, frame_0, indices, self.default_options
            )
            indices = np.array(indices)

        points_scatter = None
        points_id: list = []
        if points is not None:
            row, col, points_scatter, points_id = points.draw(ax)

        background_color_threshold = None
        if not rgb_frames:
            if self.default_options["background_color_threshold"] is not None:
                background_color_threshold = im.norm(
                    self.default_options["background_color_threshold"]
                )
            else:
                ref_for_threshold = array if data_getter is None else frame_0
                background_color_threshold = im.norm(np.nanmax(ref_for_threshold)) / 2.0

        day_text = frame_label.draw(ax, self.default_options["cbar_label_size"])
        self._day_text = day_text

        def _fetch_frame(i: int) -> np.ndarray:
            """Resolve frame `i` for the animation step.

            Routes between the eager `self.arr[i]` path and the lazy
            `data_getter(i)` callback added in CLEO-7. The frame's
            spatial dims (its first two axes) must always match
            `self.arr.shape[-2:]`; the callback variant re-validates
            per call to catch upstream shape drift (e.g. a NetCDF slab
            that changed size between frames).

            Args:
                i: Zero-based frame index. Must be a valid index into
                    the time axis (`0 <= i < n_frames`).

            Returns:
                np.ndarray: The frame for index `i` — a 2-D single-band
                    array, or a `(rows, cols, 3|4)` RGB / RGBA array —
                    whose spatial dims equal `self.arr.shape[-2:]`.

            Raises:
                ValueError: If `data_getter` is set and the callback
                    returns a frame whose spatial dims do not match
                    `self.arr.shape[-2:]`.
            """
            if data_getter is None:
                frame = array[i] if rgb_frames else array[i, :, :]
            else:
                frame = np.asarray(data_getter(i))
                expected_hw = tuple(array.shape[-2:])
                actual_hw = frame.shape[:2] if _is_rgb_frame(frame) else frame.shape
                if actual_hw != expected_hw:
                    raise ValueError(
                        f"`data_getter` returned shape {frame.shape}, whose "
                        f"spatial dims {actual_hw} do not match {expected_hw}."
                    )
            return np.asarray(frame)

        hillshade_opts = resolve_hillshade(self.default_options.get("hillshade"))
        if style_categorical:
            hillshade_opts = None

        def _display_frame(frame):
            """Return the frame's image data: preset RGBA, relief-shaded, or raw."""
            if style_render is not None:
                filled = np.asarray(
                    ma.filled(ma.asarray(frame).astype(float), np.nan), dtype=float
                )
                if style_render[0] == "categorical":
                    _, cat_cmap, cat_norm, cat_values = style_render
                    masked = np.where(np.isin(filled, cat_values), filled, np.nan)
                    rgba = np.asarray(cat_cmap(cat_norm(masked)), dtype=float)
                    rgba[~np.isfinite(masked)] = 0.0
                    return rgba
                _, cmap_, norm_, alpha_norm_, const_ = style_render
                rgba = alpha_rgba(filled, cmap_, norm_, alpha_norm_, const_)
                if hillshade_opts is not None:
                    rgba = shade_rgb(rgba, filled, **hillshade_opts)
                return rgba
            if hillshade_opts is not None and not rgb_frames:
                # Cast before filling: integer masked frames reject a NaN fill.
                elevation = np.asarray(
                    ma.filled(ma.asarray(frame).astype(float), np.nan), dtype=float
                )
                return shade_grid(elevation, im.cmap, norm=im.norm, **hillshade_opts)
            return frame

        def init():
            """initialize the plot with the cached first frame"""
            im.set_data(_display_frame(frame_0))
            day_text.set_text("")
            output = [im, day_text]

            if points is not None:
                scatter = cast(PathCollection, points_scatter)  # set when points given
                scatter.set_offsets(np.c_[col, row])
                output.append(scatter)
                update_points = lambda x: points_id[x].set_text(points.points[x, 0])
                list(map(update_points, range(len(col))))

                output += points_id

            if show_cell_value:
                vals = frame_0[indices[:, 0], indices[:, 1]]
                update_cell_value = lambda x: cell_text_value[x].set_text(vals[x])
                list(map(update_cell_value, range(len(cell_text_value))))
                output += cell_text_value

            return output

        def animate_a(i):
            """plot for each element in the iterable."""
            frame = _fetch_frame(i)
            im.set_data(_display_frame(frame))
            day_text.set_text("Date = " + str(time[i])[0:10])
            output = [im, day_text]

            if points is not None:
                scatter = cast(PathCollection, points_scatter)  # set when points given
                scatter.set_offsets(np.c_[col, row])
                output.append(scatter)

                for x in range(len(col)):
                    points_id[x].set_text(points.points[x, 0])

                output += points_id

            if show_cell_value:
                vals = frame[indices[:, 0], indices[:, 1]]

                def update_cell_value(x):
                    """Update cell value"""
                    val = round(vals[x], precision)
                    kw = {
                        "color": cell_value_text_colors[
                            int(im.norm(vals[x]) > background_color_threshold)
                        ]
                    }
                    cell_text_value[x].update(kw)
                    cell_text_value[x].set_text(val)

                list(map(update_cell_value, range(len(cell_text_value))))

                output += cell_text_value

            return output

        if basemap is not None:
            self._draw_basemap(basemap)
        if full_bleed:
            self._apply_full_bleed(
                facecolor=full_bleed if isinstance(full_bleed, str) else None
            )
        else:
            plt.tight_layout()
            if getattr(self, "_auto_figure", False):
                self._tighten_figure()
        anim = FuncAnimation(
            fig,
            animate_a,
            init_func=init,
            frames=n_frames,
            interval=interval,
            blit=True,
        )
        self._anim = anim
        _mark_render_artists(
            ax,
            self,
            self.cbar,
            self.im,
            self._day_text,
            points_scatter,
            *points_id,
            *cell_text_value,
        )
        return anim

arr property writable #

The (masked) array held by the glyph.

The array is stored as a numpy.ma.MaskedArray; cells matching exclude_value (or NaN) are masked so they are excluded from the colour range and rendered as gaps.

Returns:

Type Description

numpy.ma.MaskedArray: The array backing this glyph.

Examples:

  • Read the array back and inspect its shape and a value:
    >>> import numpy as np
    >>> from cleopatra.glyphs.gridded.array_glyph import ArrayGlyph
    >>> glyph = ArrayGlyph(np.array([[1.0, 2.0, 3.0], [4.0, 5.0, 6.0]]))
    >>> glyph.arr.shape
    (2, 3)
    >>> float(glyph.arr[0, 0])
    1.0
    

coords property #

Optional (x, y) coordinate arrays for curvilinear grids.

Returns the validated coordinate pair stored at construction time, or None when the glyph was built without coords (regular pixel-grid render). When non-None, plot(kind="auto") routes to pcolormesh so the (x, y) arrays are honoured.

Returns:

Type Description
tuple[ndarray, ndarray] | None

tuple[np.ndarray, np.ndarray] or None: The (x, y) pair as stored on the instance (each cast to numpy.ndarray), or None.

Examples:

  • A glyph built without coords reports None:
    >>> import numpy as np
    >>> from cleopatra.glyphs.gridded.array_glyph import ArrayGlyph
    >>> glyph = ArrayGlyph(np.zeros((3, 4)))
    >>> glyph.coords is None
    True
    
  • A glyph built with 1-D centres exposes the validated arrays back through the property:
    >>> import numpy as np
    >>> from cleopatra.glyphs.gridded.array_glyph import ArrayGlyph
    >>> arr = np.zeros((3, 4))
    >>> x = np.linspace(0.0, 3.0, 4)
    >>> y = np.linspace(0.0, 2.0, 3)
    >>> glyph = ArrayGlyph(arr, coords=(x, y))
    >>> xs, ys = glyph.coords
    >>> xs.shape, ys.shape
    ((4,), (3,))
    >>> float(xs[-1]), float(ys[-1])
    (3.0, 2.0)
    

exclude_value property writable #

Value(s) treated as nodata and masked out of the array.

Cells equal to exclude_value are masked so they are excluded from the colour range and rendered as gaps. Defaults to nan.

Returns:

Type Description

The excluded value, or a list of excluded values.

Examples:

  • With no explicit nodata, NaN is excluded by default:
    >>> import math
    >>> import numpy as np
    >>> from cleopatra.glyphs.gridded.array_glyph import ArrayGlyph
    >>> glyph = ArrayGlyph(np.array([[1.0, 2.0], [3.0, 4.0]]))
    >>> math.isnan(glyph.exclude_value)
    True
    
  • Excluding a sentinel masks the matching cells:
    >>> import numpy as np
    >>> from cleopatra.glyphs.gridded.array_glyph import ArrayGlyph
    >>> arr = np.array([[1.0, 2.0], [3.0, -9.0]])
    >>> glyph = ArrayGlyph(arr, exclude_value=[-9.0])
    >>> glyph.exclude_value
    [-9.0]
    >>> int(glyph.arr.mask.sum())
    1
    

style property #

Name of the DATA_STYLES preset currently applied, or None.

Reads back the preset set via the style constructor kwarg, a plot(style=...) call, or apply_style.

__init__(array, exclude_value=np.nan, extent=None, coords=None, rgb_bands=None, ax=None, fig=None, **kwargs) #

Initialize the ArrayGlyph object with an array and optional parameters.

Parameters:

Name Type Description Default
array ndarray

The array to be visualized. Can be a 2D array for single plots or a 3D array for RGB plots or animations.

required
exclude_value float | list

Value(s) used to mask cells out of the domain, by default np.nan. Can be a single value or a list of values to exclude.

nan
extent list | None

The extent of the array in the format [xmin, ymin, xmax, ymax], by default None. If provided, the array will be plotted with these spatial boundaries. Mutually exclusive with coords.

None
coords tuple[ndarray, ndarray] | list[ndarray] | None

Optional (x, y) coordinate arrays for curvilinear or non-uniform grids, by default None. Each element is either a 1-D array of cell centres (length matches the last/second-to-last axis of array) or a 2-D array matching the last two axes of array. When set, kind="auto" routes to pcolormesh instead of imshow. Mutually exclusive with extent.

None
rgb_bands RgbBands | None

An RgbBands bundling the band indices and stretch for an RGB image, by default None. When given, the array is treated as band-first and composited to RGB via RgbBands.prepare (band selection plus a percentile / surface-reflectance / cutoff stretch). Replaces the former loose rgb, surface_reflectance, cutoff, and percentile keywords.

None
ax Axes | None

A pre-existing axes to plot on, by default None. Bound to the glyph and used by plot/animate unless plot(ax=...) overrides it. Passing ax alone is enough — its parent figure is derived automatically; if None (and no axes is given to plot), a new axes is created.

None
fig Figure | None

A pre-existing figure to bind, by default None. fig is a construction-time binding only (it is never a plot parameter — plot derives the figure from its axes). When ax is given, fig is optional; if both are None a new figure is created at render time. Passing fig alone (no ax) draws into that figure — its first axes, or a fresh one if it has none.

None
**kwargs

Additional keyword arguments for customizing the plot. Supported arguments include: figsize : tuple, optional Figure size, by default (8, 8). vmin : float, optional Minimum value for color scaling, by default min(array). vmax : float, optional Maximum value for color scaling, by default max(array). title : str, optional Title of the plot, by default 'Array Plot'. title_size : int, optional Title font size, by default 15. cmap : str or matplotlib.colors.Colormap, optional Colormap, by default 'coolwarm_r'. A plain matplotlib name (e.g. 'viridis') or a Colormap object is used as-is; a namespaced name such as 'cmocean:thermal' or 'cmasher:ember' is resolved via the optional cmap aggregator — install the [science-colors] extra (pip install cleopatra[science-colors]). The _r reverse suffix works on both forms. kind : str, optional Render kind. One of "auto", "imshow", "pcolormesh", "contour", "contourf". Default "auto" (currently equivalent to "imshow"). Stored on the instance and used as the default for plot. robust : bool, optional When True, vmin / vmax are computed from the 2nd and 98th percentile of the unmasked data (xarray-aligned). An explicit vmin / vmax wins over robust. Default False. center : float, optional Diverging-colormap centring value. When set, (vmin, vmax) is made symmetric around center and the cmap auto-switches to "RdBu_r" if no explicit cmap was passed. Default None (no centring). levels : int or sequence, optional Discrete colour levels (xarray-aligned). An int selects N linearly-spaced edges between vmin and vmax; a sequence is used as explicit edges. Default None. extend : str, optional Colorbar arrow extension. One of "neither", "both", "min", "max", or None to auto-resolve at render time. Default None. cbar_kwargs : dict, optional Extra keyword arguments forwarded to fig.colorbar; user keys win over cleopatra's defaults on collision. Default None.

{}
data_style

Grouped style / hillshade / bands / alpha / alpha_range options applied at construction, e.g. data_style=DataStyle(style="topography"). These are rejected as loose keywords, so the group is how they are set here rather than on every plot() call; the value is sticky across later calls. Default None.

required

Raises:

Type Description
ValueError

If an invalid keyword argument is provided.

ValueError

If rgb_bands is given but the array has fewer than 3 bands.

ValueError

If extend is set to a value outside {"neither", "both", "min", "max"}.

ValueError

If both extent and coords are supplied, or if a coords element has a shape that does not match array.

TypeError

If coords is not a length-2 sequence of ndarrays.

Examples: Basic initialization with a 2D array:

>>> import numpy as np
>>> from cleopatra.glyphs.gridded.array_glyph import ArrayGlyph
>>> arr = np.array([[1, 2, 3], [4, 5, 6], [7, 8, 9]])
>>> array_glyph = ArrayGlyph(arr)
>>> fig, ax = array_glyph.plot()
Initialization with custom figure size and title:
>>> array_glyph = ArrayGlyph(arr, figsize=(10, 8), title="Custom Array Plot")
>>> fig, ax = array_glyph.plot()
Initialization with RGB bands from a 3D array:
>>> from cleopatra.glyphs.gridded.array_glyph import RgbBands
>>> rgb_array = np.random.randint(0, 255, size=(3, 10, 10))
>>> rgb_glyph = ArrayGlyph(
...     rgb_array, rgb_bands=RgbBands([0, 1, 2], surface_reflectance=255)
... )
>>> fig, ax = rgb_glyph.plot()
Initialization with custom extent:
>>> array_glyph = ArrayGlyph(arr, extent=[0, 0, 10, 10])
>>> fig, ax = array_glyph.plot()
Robust colour limits (xarray-aligned robust=True clips the 2nd/98th percentile so a few outliers do not dominate the scale):
>>> import numpy as np
>>> from cleopatra.glyphs.gridded.array_glyph import ArrayGlyph
>>> data = np.arange(100, dtype=float).reshape(10, 10)
>>> data[0, 0] = 1e6  # outlier
>>> glyph = ArrayGlyph(data, robust=True)
>>> round(glyph.vmin, 1), round(glyph.vmax, 1)
(3.0, 98.0)
Centring on a value for diverging data (auto-switches the cmap to "RdBu_r" when no cmap is passed):
>>> import numpy as np
>>> from cleopatra.glyphs.gridded.array_glyph import ArrayGlyph
>>> anomaly = np.linspace(-3.0, 8.0, 25).reshape(5, 5)
>>> glyph = ArrayGlyph(anomaly, center=0.0)
>>> glyph.vmin, glyph.vmax
(-8.0, 8.0)
>>> glyph.default_options["cmap"]
'RdBu_r'
Combining levels, extend and cbar_kwargs (forwarded to matplotlib.colorbar.Colorbar):
>>> import numpy as np
>>> from cleopatra.glyphs.gridded.array_glyph import ArrayGlyph
>>> arr = np.arange(25, dtype=float).reshape(5, 5)
>>> glyph = ArrayGlyph(
...     arr,
...     extend="both",
...     cbar_kwargs={"shrink": 0.6},
... )
>>> glyph.default_options["extend"]
'both'
>>> glyph.default_options["cbar_kwargs"]
{'shrink': 0.6}
Invalid extend is rejected at construction time:
>>> import numpy as np
>>> from cleopatra.glyphs.gridded.array_glyph import ArrayGlyph
>>> ArrayGlyph(np.array([[0.0, 1.0]]), extend="up")
Traceback (most recent call last):
    ...
ValueError: Invalid extend='up'. Valid values are ('neither', 'both', 'min', 'max') or None.
Curvilinear coords (1-D centres) auto-route to pcolormesh:
>>> import numpy as np
>>> from cleopatra.glyphs.gridded.array_glyph import ArrayGlyph
>>> arr = np.arange(12, dtype=float).reshape(3, 4)
>>> x = np.linspace(0.0, 10.0, 4)
>>> y = np.linspace(0.0, 5.0, 3)
>>> glyph = ArrayGlyph(arr, coords=(x, y))
>>> glyph.coords[0].shape, glyph.coords[1].shape
((4,), (3,))
extent and coords are mutually exclusive:
>>> import numpy as np
>>> from cleopatra.glyphs.gridded.array_glyph import ArrayGlyph
>>> arr = np.zeros((3, 4))
>>> x = np.linspace(0.0, 10.0, 4)
>>> y = np.linspace(0.0, 5.0, 3)
>>> ArrayGlyph(arr, extent=[0, 0, 1, 1], coords=(x, y))
Traceback (most recent call last):
    ...
ValueError: `extent` and `coords` are mutually exclusive  pass one or the other.

Source code in src/cleopatra/glyphs/gridded/array_glyph.py
def __init__(
    self,
    array: np.ndarray,
    exclude_value: float | list = np.nan,
    extent: list | None = None,
    coords: tuple[np.ndarray, np.ndarray] | list[np.ndarray] | None = None,
    rgb_bands: RgbBands | None = None,
    ax: Axes | None = None,
    fig: Figure | None = None,
    **kwargs,
):
    """Initialize the ArrayGlyph object with an array and optional parameters.

    Args:
        array: The array to be visualized. Can be a 2D array for single plots or a 3D array for RGB plots or animations.
        exclude_value: Value(s) used to mask cells out of the domain, by default np.nan.
            Can be a single value or a list of values to exclude.
        extent: The extent of the array in the format [xmin, ymin, xmax, ymax], by default None.
            If provided, the array will be plotted with these spatial boundaries.
            Mutually exclusive with `coords`.
        coords: Optional `(x, y)` coordinate arrays for curvilinear
            or non-uniform grids, by default None. Each element is
            either a 1-D array of cell centres (length matches the
            last/second-to-last axis of `array`) or a 2-D array
            matching the last two axes of `array`. When set,
            `kind="auto"` routes to `pcolormesh` instead of
            `imshow`. Mutually exclusive with `extent`.
        rgb_bands: An `RgbBands` bundling the band indices and stretch for
            an RGB image, by default None. When given, the array is treated
            as band-first and composited to RGB via `RgbBands.prepare`
            (band selection plus a percentile / surface-reflectance / cutoff
            stretch). Replaces the former loose `rgb`, `surface_reflectance`,
            `cutoff`, and `percentile` keywords.
        ax: A pre-existing axes to plot on, by default None. Bound to
            the glyph and used by `plot`/`animate` unless `plot(ax=...)`
            overrides it. Passing `ax` alone is enough — its parent
            figure is derived automatically; if None (and no axes is
            given to `plot`), a new axes is created.
        fig: A pre-existing figure to bind, by default None. `fig` is a
            construction-time binding only (it is never a `plot`
            parameter — `plot` derives the figure from its axes). When
            `ax` is given, `fig` is optional; if both are None a new
            figure is created at render time. Passing `fig` alone (no
            `ax`) draws into that figure — its first axes, or a fresh
            one if it has none.
        **kwargs: Additional keyword arguments for customizing the plot.
            Supported arguments include:
                figsize : tuple, optional
                    Figure size, by default (8, 8).
                vmin : float, optional
                    Minimum value for color scaling, by default min(array).
                vmax : float, optional
                    Maximum value for color scaling, by default max(array).
                title : str, optional
                    Title of the plot, by default 'Array Plot'.
                title_size : int, optional
                    Title font size, by default 15.
                cmap : str or matplotlib.colors.Colormap, optional
                    Colormap, by default 'coolwarm_r'. A plain matplotlib
                    name (e.g. 'viridis') or a `Colormap` object is used
                    as-is; a **namespaced** name such as 'cmocean:thermal'
                    or 'cmasher:ember' is resolved via the optional `cmap`
                    aggregator — install the `[science-colors]` extra
                    (`pip install cleopatra[science-colors]`). The `_r`
                    reverse suffix works on both forms.
                kind : str, optional
                    Render kind. One of `"auto"`, `"imshow"`,
                    `"pcolormesh"`, `"contour"`, `"contourf"`.
                    Default `"auto"` (currently equivalent to
                    `"imshow"`). Stored on the instance and used
                    as the default for `plot`.
                robust : bool, optional
                    When True, `vmin` / `vmax` are computed from
                    the 2nd and 98th percentile of the unmasked data
                    (xarray-aligned). An explicit `vmin` / `vmax`
                    wins over `robust`. Default False.
                center : float, optional
                    Diverging-colormap centring value. When set,
                    `(vmin, vmax)` is made symmetric around
                    `center` and the cmap auto-switches to
                    `"RdBu_r"` if no explicit `cmap` was passed.
                    Default None (no centring).
                levels : int or sequence, optional
                    Discrete colour levels (xarray-aligned). An
                    `int` selects N linearly-spaced edges between
                    `vmin` and `vmax`; a sequence is used as
                    explicit edges. Default None.
                extend : str, optional
                    Colorbar arrow extension. One of `"neither"`,
                    `"both"`, `"min"`, `"max"`, or None to
                    auto-resolve at render time. Default None.
                cbar_kwargs : dict, optional
                    Extra keyword arguments forwarded to
                    `fig.colorbar`; user keys win over cleopatra's
                    defaults on collision. Default None.
        data_style: Grouped `style` / `hillshade` / `bands` / `alpha` / `alpha_range` options applied at
            construction, e.g. `data_style=DataStyle(style="topography")`.
            These are rejected as loose keywords, so the group is how they
            are set here rather than on every `plot()` call; the value is
            sticky across later calls. Default None.

    Raises:
        ValueError: If an invalid keyword argument is provided.
        ValueError: If `rgb_bands` is given but the array has fewer than
            3 bands.
        ValueError: If `extend` is set to a value outside
            `{"neither", "both", "min", "max"}`.
        ValueError: If both `extent` and `coords` are supplied,
            or if a `coords` element has a shape that does not
            match `array`.
        TypeError: If `coords` is not a length-2 sequence of
            ndarrays.

    Examples:
    Basic initialization with a 2D array:
    ```python
    >>> import numpy as np
    >>> from cleopatra.glyphs.gridded.array_glyph import ArrayGlyph
    >>> arr = np.array([[1, 2, 3], [4, 5, 6], [7, 8, 9]])
    >>> array_glyph = ArrayGlyph(arr)
    >>> fig, ax = array_glyph.plot()

    ```
    Initialization with custom figure size and title:
    ```python
    >>> array_glyph = ArrayGlyph(arr, figsize=(10, 8), title="Custom Array Plot")
    >>> fig, ax = array_glyph.plot()

    ```
    Initialization with RGB bands from a 3D array:
    ```python
    >>> from cleopatra.glyphs.gridded.array_glyph import RgbBands
    >>> rgb_array = np.random.randint(0, 255, size=(3, 10, 10))
    >>> rgb_glyph = ArrayGlyph(
    ...     rgb_array, rgb_bands=RgbBands([0, 1, 2], surface_reflectance=255)
    ... )
    >>> fig, ax = rgb_glyph.plot()

    ```
    Initialization with custom extent:
    ```python
    >>> array_glyph = ArrayGlyph(arr, extent=[0, 0, 10, 10])
    >>> fig, ax = array_glyph.plot()

    ```
    Robust colour limits (xarray-aligned `robust=True` clips the
    2nd/98th percentile so a few outliers do not dominate the
    scale):
    ```python
    >>> import numpy as np
    >>> from cleopatra.glyphs.gridded.array_glyph import ArrayGlyph
    >>> data = np.arange(100, dtype=float).reshape(10, 10)
    >>> data[0, 0] = 1e6  # outlier
    >>> glyph = ArrayGlyph(data, robust=True)
    >>> round(glyph.vmin, 1), round(glyph.vmax, 1)
    (3.0, 98.0)

    ```
    Centring on a value for diverging data (auto-switches the cmap
    to `"RdBu_r"` when no `cmap` is passed):
    ```python
    >>> import numpy as np
    >>> from cleopatra.glyphs.gridded.array_glyph import ArrayGlyph
    >>> anomaly = np.linspace(-3.0, 8.0, 25).reshape(5, 5)
    >>> glyph = ArrayGlyph(anomaly, center=0.0)
    >>> glyph.vmin, glyph.vmax
    (-8.0, 8.0)
    >>> glyph.default_options["cmap"]
    'RdBu_r'

    ```
    Combining `levels`, `extend` and `cbar_kwargs` (forwarded
    to `matplotlib.colorbar.Colorbar`):
    ```python
    >>> import numpy as np
    >>> from cleopatra.glyphs.gridded.array_glyph import ArrayGlyph
    >>> arr = np.arange(25, dtype=float).reshape(5, 5)
    >>> glyph = ArrayGlyph(
    ...     arr,
    ...     extend="both",
    ...     cbar_kwargs={"shrink": 0.6},
    ... )
    >>> glyph.default_options["extend"]
    'both'
    >>> glyph.default_options["cbar_kwargs"]
    {'shrink': 0.6}

    ```
    Invalid `extend` is rejected at construction time:
    ```python
    >>> import numpy as np
    >>> from cleopatra.glyphs.gridded.array_glyph import ArrayGlyph
    >>> ArrayGlyph(np.array([[0.0, 1.0]]), extend="up")
    Traceback (most recent call last):
        ...
    ValueError: Invalid extend='up'. Valid values are ('neither', 'both', 'min', 'max') or None.

    ```
    Curvilinear coords (1-D centres) auto-route to
    `pcolormesh`:
    ```python
    >>> import numpy as np
    >>> from cleopatra.glyphs.gridded.array_glyph import ArrayGlyph
    >>> arr = np.arange(12, dtype=float).reshape(3, 4)
    >>> x = np.linspace(0.0, 10.0, 4)
    >>> y = np.linspace(0.0, 5.0, 3)
    >>> glyph = ArrayGlyph(arr, coords=(x, y))
    >>> glyph.coords[0].shape, glyph.coords[1].shape
    ((4,), (3,))

    ```
    `extent` and `coords` are mutually exclusive:
    ```python
    >>> import numpy as np
    >>> from cleopatra.glyphs.gridded.array_glyph import ArrayGlyph
    >>> arr = np.zeros((3, 4))
    >>> x = np.linspace(0.0, 10.0, 4)
    >>> y = np.linspace(0.0, 5.0, 3)
    >>> ArrayGlyph(arr, extent=[0, 0, 1, 1], coords=(x, y))
    Traceback (most recent call last):
        ...
    ValueError: `extent` and `coords` are mutually exclusive — pass one or the other.

    ```
    """
    _reject_loose_alpha(kwargs)
    _reject_loose_fill(kwargs)
    super().__init__(
        default_options=ARRAY_DEFAULT_OPTIONS, fig=fig, ax=ax, **kwargs
    )
    if exclude_value is not np.nan:
        values = cast(list, exclude_value)
        if len(values) > 1:
            mask = np.logical_or(
                np.isclose(array, values[0], rtol=0.001),
                np.isclose(array, values[1], rtol=0.001),
            )
        else:
            mask = np.isclose(array, values[0], rtol=0.0000001)
        array = ma.array(array, mask=mask, dtype=array.dtype)
    else:
        array = ma.array(array)

    # convert the extent from [xmin, ymin, xmax, ymax] to [xmin, xmax, ymin, ymax] as required by matplotlib.
    if extent is not None and coords is not None:
        raise ValueError(
            "`extent` and `coords` are mutually exclusive — pass one or the other."
        )
    if extent is not None:
        extent = [extent[0], extent[2], extent[1], extent[3]]
    self.extent = extent

    self._coords = self._validate_coords(coords, array)

    if rgb_bands is not None:
        self.rgb = True
        rgb_bands.validate(array)
        array = rgb_bands.prepare(array)
    else:
        self.rgb = False

    self._exclude_value = exclude_value
    self._validate_extend(self.default_options.get("extend"))

    explicit_keys = set(kwargs.keys())
    self._style_color_overrides: dict[str, Any] = {
        key: kwargs[key]
        for key in _STYLE_OVERRIDE_KEYS
        if key in explicit_keys and kwargs[key] is not None
    }
    #: Whether the latest plot()/animate() call explicitly requested a real
    #: colorbar (a truthy `colorbar=`), which overrides a preset's swatch.
    self._style_wants_colorbar: bool = False
    self._vmin, self._vmax = self._resolve_color_limits(
        array,
        vmin_kw=kwargs.get("vmin"),
        vmax_kw=kwargs.get("vmax"),
        robust=bool(self.default_options.get("robust", False)),
        center=self.default_options.get("center"),
        vmin_explicit="vmin" in explicit_keys,
        vmax_explicit="vmax" in explicit_keys,
    )
    #: Whether the caller pinned `vmin` themselves. A log scale floors an
    #: un-pinned `vmin` at the smallest positive non-outlier (see
    #: `_log_safe_vmin`); an explicit `vmin` must still win.
    self._vmin_explicit: bool = "vmin" in explicit_keys
    if (
        self.default_options.get("center") is not None
        and "cmap" not in explicit_keys
    ):
        self.default_options["cmap"] = DIVERGING_DEFAULT_CMAP

    self._arr = array
    self.ticks_spacing = (self._vmax - self._vmin) / 10 or 1.0
    self.num_domain_cells = self._count_domain_cells(array, self.rgb)
    self.im: Any = None
    self.cbar: Colorbar | None = None
    self._day_text: Any = None
    self.contour_labels: list[Any] | None = None

__str__() #

String representation of the Array object.

Source code in src/cleopatra/glyphs/gridded/array_glyph.py
def __str__(self):
    """String representation of the Array object."""
    message = f"""
                Min: {self.vmin}
                Max: {self.vmax}
                Exclude values: {self.exclude_value}
                RGB: {self.rgb}
            """
    return message

animate(time, points=None, *, playback=None, color=None, contour=None, cells=None, classify=None, data_style=None, full_bleed=False, basemap=None, colorbar=None, compose=False, **kwargs) #

Create an animation from a single-band or true-colour stack.

This method creates an animation by iterating the first axis of the data, turning each slice into a frame with optional time labels, point annotations, and cell-value displays. Two stack layouts are accepted:

  • a 3-D (time, rows, cols) single-band stack, rendered as a colormapped field with a colorbar (the historical behaviour); and
  • a 4-D (time, rows, cols, 3|4) RGB / RGBA stack, where each frame is drawn straight through imshow as true colour — no norm, colormap or colorbar (self.cbar is left None), and display_cell_value is ignored because per-cell annotation needs a scalar field. RGB/RGBA frames must be display-ready (floats in [0, 1] or uint8 in [0, 255], as produced by prepare_array); out-of-range values are clipped by matplotlib.

Every frame shares the glyph's single extent (one spatial domain) — there is no per-frame extent. For data spanning different domains, build one ArrayGlyph per domain instead of stacking them.

Parameters:

Name Type Description Default
time list[Any]

A list containing labels for each frame in the animation. These could be timestamps, frame numbers, or any other identifiers. The length of this list should match the first dimension of the array.

required
points PointOverlay | None

Points to display on the array, by default None. A PointOverlay bundling the (N, 3) array of [value, row, col] per point together with the marker / value-label styling (color / size / label_color / label_size).

None
playback Animation | None

Animation-specific options as an cleopatra.glyphs.gridded.array_glyph.Animation, by default None (all defaults). Bundles interval (frame delay, ms), frame_label (a FrameLabel for the per-frame time label), cell_value_text_colors (the low/high cell-value text colours), and data_getter (a lazy f(i) -> ndarray frame source). The render / colour options below stay their own arguments.

None
color ColorScaling | Normalize | None

Colour-scale group object (cleopatra.styling.scaling.ColorScaling), e.g. ColorScaling.power(gamma=0.7). Replaces the loose color_scale / gamma / line_threshold / line_scale / bounds / midpoint keywords.

None
contour Contour | None

Discretisation group object (cleopatra.styling.params.Contour), e.g. Contour(levels=5), to bin the colour scale into a BoundaryNorm for the animation (an animation has no contour/contourf kind, so only levels applies here).

None
cells CellValues | None

Per-cell value-text group object (cleopatra.styling.params.CellValues), e.g. CellValues(show=True, size=8). Replaces the loose display_cell_value / num_size / background_color_threshold keywords. (precision remains an explicit parameter; the cell-value text colours moved onto playback=Animation(cell_value_text_colors=...).)

None
classify Classify | None

Value-classification group object (cleopatra.styling.params.Classify), by default None (a continuous colour scale). Bins the stack's finite cells into discrete colour classes with a stepped colorbar, e.g. Classify(scheme="quantiles", k=5). The class edges are resolved once over the whole stack, so every frame shares one set of classes. scheme="categorical" is rejected for a raster.

None
data_style DataStyle | None

Named-preset / relief-shading group object (cleopatra.styling.params.DataStyle), e.g. DataStyle(style="dem", hillshade=True) or DataStyle(style="temperature_2m", bands=6, alpha=0.5). Replaces the loose style / hillshade keywords and the per-call preset overrides bands / alpha / alpha_range.

None
full_bleed bool | str

Fill the whole figure edge-to-edge with no chrome, by default False. True hides ticks and spines, resizes the figure so its aspect matches the georeferenced data box (from extent, so the fill introduces no distortion), and gives the axes the entire figure area (set_position([0, 0, 1, 1]), aspect="auto"); the internal tight_layout is skipped. The canvas colour is left untouched, so masked / no-data cells keep the default background rather than turning black. Pass a colour string instead (e.g. "black") to also paint the canvas that colour -- e.g. so a semi-transparent relief backdrop reads dark. Intended for chrome-free maps -- a colorbar or title has no room, so pair it with add_colorbar=False (and no title). Without an extent the axes still fills the figure but may stretch.

False
basemap bool | dict | Basemap | Callable[[Any], None] | None

A reference backdrop drawn via the glyph's own add_relief / add_features and composed with the frames by zorder (relief under the data, coastline/borders over it), by default None (no basemap). Accepts True for a sensible default (a "low" relief plus grey "50m" coastline and borders), a Basemap (the typed, validated form -- relief / features / resolution / check_alignment, with features taking Feature objects), a dict with the same keys (see GeoMixin._draw_basemap), or a callable f(glyph) for full control. On a value-linked-opacity style (e.g. temperature_flame) the cool areas reveal the terrain while the data glows on top. Drawing the relief needs the [tiles] extra (Pillow).

None
colorbar bool | ColorBar | None

Colorbar presence and placement. None (default) keeps matplotlib's placement (honouring the legacy add_colorbar); False draws no colorbar; True a default one. Pass a ColorBar for control -- an edge (location), an inside inset that tracks full_bleed, a backing box (defaulted on for an inset), and text colours (label_color for the title, tick_color for the tick numbers). Same flag as plot(colorbar=). On a style= preset, a placement ColorBar (or True) overrides the swatch with a real colorbar; a colours-only ColorBar styles the swatch in place (defaults < preset < explicit).

None
compose bool

Draw over whatever is already on ax instead of replacing it, leaving another glyph's layers, colorbar, title and ticks intact. Off by default, where a render replaces every glyph's artists on the axes (see issue #210). Same flag as plot(compose=), including the colorbar default: a composed animation draws none of its own unless the caller asks with colorbar= or add_colorbar=True, so the host keeps the geometry it had.

False
**kwargs Unpack[AnimateKwargs]

Additional keyword arguments for customizing the animation.

Plot appearance: title : str, optional Title of the plot, by default 'Array Plot'. title_size : int, optional Title font size, by default 15. cmap : str or matplotlib.colors.Colormap, optional Colormap, by default 'coolwarm_r'. A plain matplotlib name (e.g. 'viridis') or a Colormap object is used as-is; a namespaced name such as 'cmocean:thermal' or 'cmasher:ember' is resolved via the optional cmap aggregator — install the [science-colors] extra (pip install cleopatra[science-colors]). The _r reverse suffix works on both forms. vmin : float, optional Minimum value for color scaling, by default min(array). vmax : float, optional Maximum value for color scaling, by default max(array).

Color bar options: add_colorbar : bool, optional Whether to draw the glyph's own color bar, by default True -- except under compose=True, which defaults it off so the animation does not take space from the host axes; passing it there (True or False) still decides the matter. With it off self.cbar stays None, no axes space is taken by a color bar, and the mappable is still reachable via self.im. cbar_orientation : str, optional Prefer colorbar=ColorBar(orientation=...). Orientation of the color bar, by default 'vertical'. Can be 'horizontal' or 'vertical'. cbar_label_rotation : float, optional Prefer colorbar=ColorBar(label_rotation=...). Rotation angle (degrees) of the color bar label, by default None (matplotlib's own label orientation). cbar_label_location : str, optional Prefer colorbar=ColorBar(label_location=...). Location of the color bar label, by default 'center'. Valid values depend on the bar orientation -- vertical: 'top'/'center'/'bottom'; horizontal: 'left'/'center'/'right'. cbar_length : float, optional Prefer colorbar=ColorBar(length=...). Ratio to control the height/width of the color bar, by default 0.75. ticks_spacing : int, optional Prefer colorbar=ColorBar(ticks_spacing=...). Spacing between ticks on the color bar, by default 5. cbar_label_size : int, optional Prefer colorbar=ColorBar(label_size=...). Font size of the color bar label, by default 12. cbar_label : str, optional Prefer colorbar=ColorBar(label=...). Label text for the color bar, by default None.

Grouped options (moved off **kwargs): The colour-scale options (color_scale, gamma, line_threshold, line_scale, bounds, midpoint) move to color=ColorScaling(...); the per-cell value text (display_cell_value, num_size, background_color_threshold) moves to cells=CellValues(...); the named preset and relief shading (style, hillshade) move to data_style=DataStyle(...). See cleopatra.styling.scaling.ColorScaling and cleopatra.styling.params. Passing any of them as a loose keyword raises with a pointer to the object.

precision : int, optional
    Decimal places each frame's cell value text is
    rounded to, by default 2. `animate`-only, and still
    a loose keyword (not part of `CellValues`).
{}

Returns:

Type Description
FuncAnimation

matplotlib.animation.FuncAnimation: The animation object that can be displayed in a notebook or saved to a file.

FuncAnimation

As with plot, the first-frame colour-mapped artist is stored on

FuncAnimation

the instance as self.im (and the colorbar, when drawn, on

FuncAnimation

self.cbar), so a caller can attach a host-owned

FuncAnimation

colorbar/legend without scraping the axes.

Raises:

Type Description
ValueError

If an invalid keyword argument is provided.

ValueError

If the length of the time list doesn't match the first dimension of the array.

ValueError

If data_getter is None and self.arr is neither a 3-D (time, rows, cols) nor a 4-D (time, rows, cols, 3|4) array (no time axis to iterate over).

ValueError

If data_getter is set and a returned frame's spatial dims do not match self.arr.shape[-2:].

Notes

The animation is created by iterating through the first dimension of the array. For example, if the array has shape (10, 20, 30), the animation will have 10 frames, each showing a 20x30 slice of the array.

This method does not call plt.show(); it returns the FuncAnimation so the caller controls display. In an interactive (non-notebook) session call plt.show() yourself to play it, or use save_animation to write it to a file.

To display the animation in a Jupyter notebook, you may need to use:

from IPython.display import HTML
HTML(anim_obj.to_jshtml())

To save the animation to a file, use the save_animation method after creating the animation.

Examples: Basic animation from a 3D array:

>>> import numpy as np
>>> from cleopatra.glyphs.gridded.array_glyph import ArrayGlyph
>>> # Create a 3D array with 5 frames, each 10x10
>>> arr = np.random.randint(1, 10, size=(5, 10, 10))
>>> # Create labels for each frame
>>> frame_labels = ["Frame 1", "Frame 2", "Frame 3", "Frame 4", "Frame 5"]
>>> # Create the ArrayGlyph object
>>> animated_array = ArrayGlyph(arr, figsize=(8, 8), title="Animated Array")
>>> # Create the animation
>>> anim_obj = animated_array.animate(frame_labels)
Animation with custom interval (speed):
>>> animated_array = ArrayGlyph(arr, figsize=(8, 8), title="Animated Array")
>>> # Slower animation (500ms between frames)
>>> anim_obj = animated_array.animate(frame_labels, playback=Animation(interval=500))
>>> animated_array = ArrayGlyph(arr, figsize=(8, 8), title="Animated Array")
>>> # Faster animation (100ms between frames)
>>> anim_obj = animated_array.animate(frame_labels, playback=Animation(interval=100))
Animation with points:
>>> # Create a styled point overlay to display on the animation
>>> from cleopatra.glyphs.gridded.array_glyph import PointOverlay
>>> overlay = PointOverlay(
...     np.array([[1, 2, 3], [2, 5, 5], [3, 8, 8]]),
...     color="black",
...     size=150,
...     label_color="white",
...     label_size=12,
... )
>>> animated_array = ArrayGlyph(arr, figsize=(8, 8), title="Animated Array")
>>> anim_obj = animated_array.animate(frame_labels, points=overlay)
Animation with cell values displayed:
>>> animated_array = ArrayGlyph(arr, figsize=(8, 8), title="Animated Array")
>>> anim_obj = animated_array.animate(
...     frame_labels,
...     cells=CellValues(show=True, size=10),
...     playback=Animation(cell_value_text_colors=("yellow", "blue")),
... )
animated_array

Saving the animation to a file:

>>> # Create the animation first
>>> animated_array = ArrayGlyph(arr, figsize=(8, 8), title="Animated Array")
>>> anim_obj = animated_array.animate(frame_labels)
>>> # Then save it to a file
>>> animated_array.save_animation("animation.gif", fps=2)
Lazy frame streaming via data_getter (the callback supplies frame i on demand — useful for NetCDF time slabs or any source where eager loading is too expensive). The data array on the glyph acts as a shape template; only its last two axes are read.
>>> import numpy as np
>>> from cleopatra.glyphs.gridded.array_glyph import ArrayGlyph
>>> template = np.arange(36, dtype=float).reshape(1, 6, 6)
>>> glyph = ArrayGlyph(template, figsize=(4, 4), title="Lazy")
>>> labels = ["t0", "t1", "t2"]
>>> def get_frame(i):
...     return np.full((6, 6), float(i)) + np.arange(36).reshape(6, 6)
>>> anim_obj = glyph.animate(labels, playback=Animation(data_getter=get_frame))
>>> anim_obj._fig is glyph.fig
True
True-colour animation from a 4-D (time, rows, cols, 3) RGB stack. Each frame is drawn as true colour, so no colorbar is created (glyph.cbar stays None):
>>> import numpy as np
>>> from cleopatra.glyphs.gridded.array_glyph import ArrayGlyph
>>> rgb_stack = np.linspace(0.0, 1.0, 3 * 6 * 6 * 3).reshape(3, 6, 6, 3)
>>> glyph = ArrayGlyph(rgb_stack, figsize=(4, 4), title="RGB")
>>> anim_obj = glyph.animate(["t0", "t1", "t2"])
>>> glyph.cbar is None
True
Full-bleed layout: no chrome (ticks/spines) and the axes taking the whole figure. full_bleed=True leaves the canvas colour alone; pass a colour (full_bleed="black") to also paint it, so masked cells read dark:
>>> import numpy as np
>>> from cleopatra.glyphs.gridded.array_glyph import ArrayGlyph
>>> stack = np.arange(3 * 6 * 8, dtype=float).reshape(3, 6, 8)
>>> glyph = ArrayGlyph(stack, extent=[0, 0, 8, 6])
>>> anim_obj = glyph.animate(
...     ["t0", "t1", "t2"], full_bleed="black", add_colorbar=False
... )
>>> tuple(round(float(v), 3) for v in glyph.ax.get_position().bounds)
(0.0, 0.0, 1.0, 1.0)
>>> glyph.ax.get_facecolor()
(0.0, 0.0, 0.0, 1.0)
Compose a reference basemap under the frames (basemap=True) -- relief below, coastline and borders over. The animate call is +SKIPped in doctest because it downloads the [tiles] assets on first use:
>>> import numpy as np
>>> from cleopatra.glyphs.gridded.array_glyph import ArrayGlyph
>>> stack = np.arange(3 * 20 * 30, dtype=float).reshape(3, 20, 30)
>>> glyph = ArrayGlyph(stack, extent=[-12, 34, 32, 64])
>>> anim_obj = glyph.animate(  # doctest: +SKIP
...     ["t0", "t1", "t2"], basemap=True, full_bleed=True, add_colorbar=False
... )

Source code in src/cleopatra/glyphs/gridded/array_glyph.py
5046
5047
5048
5049
5050
5051
5052
5053
5054
5055
5056
5057
5058
5059
5060
5061
5062
5063
5064
5065
5066
5067
5068
5069
5070
5071
5072
5073
5074
5075
5076
5077
5078
5079
5080
5081
5082
5083
5084
5085
5086
5087
5088
5089
5090
5091
5092
5093
5094
5095
5096
5097
5098
5099
5100
5101
5102
5103
5104
5105
5106
5107
5108
5109
5110
5111
5112
5113
5114
5115
5116
5117
5118
5119
5120
5121
5122
5123
5124
5125
5126
5127
5128
5129
5130
5131
5132
5133
5134
5135
5136
5137
5138
5139
5140
5141
5142
5143
5144
5145
5146
5147
5148
5149
5150
5151
5152
5153
5154
5155
5156
5157
5158
5159
5160
5161
5162
5163
5164
5165
5166
5167
5168
5169
5170
5171
5172
5173
5174
5175
5176
5177
5178
5179
5180
5181
5182
5183
5184
5185
5186
5187
5188
5189
5190
5191
5192
5193
5194
5195
5196
5197
5198
5199
5200
5201
5202
5203
5204
5205
5206
5207
5208
5209
5210
5211
5212
5213
5214
5215
5216
5217
5218
5219
5220
5221
5222
5223
5224
5225
5226
5227
5228
5229
5230
5231
5232
5233
5234
5235
5236
5237
5238
5239
5240
5241
5242
5243
5244
5245
5246
5247
5248
5249
5250
5251
5252
5253
5254
5255
5256
5257
5258
5259
5260
5261
5262
5263
5264
5265
5266
5267
5268
5269
5270
5271
5272
5273
5274
5275
5276
5277
5278
5279
5280
5281
5282
5283
5284
5285
5286
5287
5288
5289
5290
5291
5292
5293
5294
5295
5296
5297
5298
5299
5300
5301
5302
5303
5304
5305
5306
5307
5308
5309
5310
5311
5312
5313
5314
5315
5316
5317
5318
5319
5320
5321
5322
5323
5324
5325
5326
5327
5328
5329
5330
5331
5332
5333
5334
5335
5336
5337
5338
5339
5340
5341
5342
5343
5344
5345
5346
5347
5348
5349
5350
5351
5352
5353
5354
5355
5356
5357
5358
5359
5360
5361
5362
5363
5364
5365
5366
5367
5368
5369
5370
5371
5372
5373
5374
5375
5376
5377
5378
5379
5380
5381
5382
5383
5384
5385
5386
5387
5388
5389
5390
5391
5392
5393
5394
5395
5396
5397
5398
5399
5400
5401
5402
5403
5404
5405
5406
5407
5408
5409
5410
5411
5412
5413
5414
5415
5416
5417
5418
5419
5420
5421
5422
5423
5424
5425
5426
5427
5428
5429
5430
5431
5432
5433
5434
5435
5436
5437
5438
5439
5440
5441
5442
5443
5444
5445
5446
5447
5448
5449
5450
5451
5452
5453
5454
5455
5456
5457
5458
5459
5460
5461
5462
5463
5464
5465
5466
5467
5468
5469
5470
5471
5472
5473
5474
5475
5476
5477
5478
5479
5480
5481
5482
5483
5484
5485
5486
5487
5488
5489
5490
5491
5492
5493
5494
5495
5496
5497
5498
5499
5500
5501
5502
5503
5504
5505
5506
5507
5508
5509
5510
5511
5512
5513
5514
5515
5516
5517
5518
5519
5520
5521
5522
5523
5524
5525
5526
5527
5528
5529
5530
5531
5532
5533
5534
5535
5536
5537
5538
5539
5540
5541
5542
5543
5544
5545
5546
5547
5548
5549
5550
5551
5552
5553
5554
5555
5556
5557
5558
5559
5560
5561
5562
5563
5564
5565
5566
5567
5568
5569
5570
5571
5572
5573
5574
5575
5576
5577
5578
5579
5580
5581
5582
5583
5584
5585
5586
5587
5588
5589
5590
5591
5592
5593
5594
5595
5596
5597
5598
5599
5600
5601
5602
5603
5604
5605
5606
5607
5608
5609
5610
5611
5612
5613
5614
5615
5616
5617
5618
5619
5620
5621
5622
5623
5624
5625
5626
5627
5628
5629
5630
5631
5632
5633
5634
5635
5636
5637
5638
5639
5640
5641
5642
5643
5644
5645
5646
5647
5648
5649
5650
5651
5652
5653
5654
5655
5656
5657
5658
5659
5660
5661
5662
5663
5664
5665
5666
5667
5668
5669
5670
5671
5672
5673
5674
5675
5676
5677
5678
5679
5680
5681
5682
5683
5684
5685
5686
5687
5688
5689
5690
5691
5692
5693
5694
5695
5696
5697
5698
5699
5700
5701
5702
5703
5704
5705
5706
5707
5708
5709
5710
5711
5712
5713
5714
5715
5716
5717
5718
5719
5720
5721
5722
5723
5724
5725
5726
5727
5728
5729
5730
5731
5732
5733
5734
5735
5736
5737
5738
5739
5740
5741
5742
5743
5744
5745
5746
5747
5748
5749
5750
5751
5752
5753
5754
5755
5756
5757
5758
5759
5760
5761
5762
5763
5764
5765
5766
5767
5768
5769
5770
5771
5772
5773
5774
5775
5776
5777
5778
5779
5780
5781
5782
5783
5784
5785
5786
5787
5788
5789
5790
5791
5792
5793
5794
5795
5796
5797
5798
5799
5800
5801
5802
5803
5804
5805
5806
5807
5808
5809
5810
5811
5812
5813
5814
5815
5816
5817
5818
5819
5820
5821
5822
5823
5824
5825
5826
5827
5828
5829
5830
5831
5832
5833
5834
5835
5836
5837
5838
5839
5840
5841
5842
5843
5844
5845
5846
5847
5848
5849
5850
5851
5852
5853
5854
5855
def animate(
    self,
    time: list[Any],
    points: PointOverlay | None = None,
    *,
    playback: Animation | None = None,
    color: ColorScaling | Normalize | None = None,
    contour: Contour | None = None,
    cells: CellValues | None = None,
    classify: Classify | None = None,
    data_style: DataStyle | None = None,
    full_bleed: bool | str = False,
    basemap: bool | dict | Basemap | Callable[[Any], None] | None = None,
    colorbar: bool | ColorBar | None = None,
    compose: bool = False,
    **kwargs: Unpack[AnimateKwargs],
) -> FuncAnimation:
    """Create an animation from a single-band or true-colour stack.

    This method creates an animation by iterating the first axis of the
    data, turning each slice into a frame with optional time labels, point
    annotations, and cell-value displays. Two stack layouts are accepted:

    - a 3-D `(time, rows, cols)` single-band stack, rendered as a
      colormapped field with a colorbar (the historical behaviour); and
    - a 4-D `(time, rows, cols, 3|4)` RGB / RGBA stack, where each frame is
      drawn straight through `imshow` as true colour — no norm, colormap or
      colorbar (`self.cbar` is left `None`), and `display_cell_value` is
      ignored because per-cell annotation needs a scalar field. RGB/RGBA
      frames must be display-ready (floats in `[0, 1]` or `uint8` in
      `[0, 255]`, as produced by `prepare_array`); out-of-range values are
      clipped by matplotlib.

    Every frame shares the glyph's single `extent` (one spatial domain) —
    there is no per-frame extent. For data spanning different domains, build
    one `ArrayGlyph` per domain instead of stacking them.

    Args:
        time: A list containing labels for each frame in the animation.
            These could be timestamps, frame numbers, or any other identifiers.
            The length of this list should match the first dimension of the array.
        points: Points to display on the array, by default None. A
            `PointOverlay` bundling the `(N, 3)` array of
            `[value, row, col]` per point together with the marker /
            value-label styling (`color` / `size` / `label_color` /
            `label_size`).
        playback: Animation-specific options as an
            `cleopatra.glyphs.gridded.array_glyph.Animation`, by default
            `None` (all defaults). Bundles `interval` (frame delay, ms),
            `frame_label` (a `FrameLabel` for the per-frame time label),
            `cell_value_text_colors` (the low/high cell-value text colours),
            and `data_getter` (a lazy `f(i) -> ndarray` frame source). The
            render / colour options below stay their own arguments.
        color: Colour-scale group object
            (`cleopatra.styling.scaling.ColorScaling`), e.g.
            `ColorScaling.power(gamma=0.7)`. Replaces the loose
            `color_scale` / `gamma` / `line_threshold` / `line_scale` /
            `bounds` / `midpoint` keywords.
        contour: Discretisation group object
            (`cleopatra.styling.params.Contour`), e.g.
            `Contour(levels=5)`, to bin the colour scale into a
            `BoundaryNorm` for the animation (an animation has no
            `contour`/`contourf` kind, so only `levels` applies here).
        cells: Per-cell value-text group object
            (`cleopatra.styling.params.CellValues`), e.g.
            `CellValues(show=True, size=8)`. Replaces the loose
            `display_cell_value` / `num_size` /
            `background_color_threshold` keywords. (`precision` remains an
            explicit parameter; the cell-value text colours moved onto
            `playback=Animation(cell_value_text_colors=...)`.)
        classify: Value-classification group object
            (`cleopatra.styling.params.Classify`), by default `None`
            (a continuous colour scale). Bins the stack's finite cells into
            discrete colour classes with a stepped colorbar, e.g.
            `Classify(scheme="quantiles", k=5)`. The class edges are resolved
            **once over the whole stack**, so every frame shares one set of
            classes. `scheme="categorical"` is rejected for a raster.
        data_style: Named-preset / relief-shading group object
            (`cleopatra.styling.params.DataStyle`), e.g.
            `DataStyle(style="dem", hillshade=True)` or
            `DataStyle(style="temperature_2m", bands=6, alpha=0.5)`.
            Replaces the loose `style` / `hillshade` keywords and the
            per-call preset overrides `bands` / `alpha` / `alpha_range`.
        full_bleed: Fill the whole figure edge-to-edge with no chrome, by
            default False. `True` hides ticks and spines, resizes the figure
            so its aspect matches the georeferenced data box (from `extent`,
            so the fill introduces no distortion), and gives the axes the
            entire figure area (`set_position([0, 0, 1, 1])`,
            `aspect="auto"`); the internal `tight_layout` is skipped. The
            canvas colour is left untouched, so masked / no-data cells keep
            the default background rather than turning black. Pass a colour
            string instead (e.g. `"black"`) to also paint the canvas that
            colour -- e.g. so a semi-transparent relief backdrop reads dark.
            Intended for chrome-free maps -- a colorbar or title has no room,
            so pair it with `add_colorbar=False` (and no `title`). Without an
            `extent` the axes still fills the figure but may stretch.
        basemap: A reference backdrop drawn via the glyph's own
            `add_relief` / `add_features` and composed with the frames by
            `zorder` (relief under the data, coastline/borders over it), by
            default None (no basemap). Accepts ``True`` for a sensible
            default (a `"low"` relief plus grey `"50m"` coastline and
            borders), a `Basemap` (the typed, validated form -- `relief` /
            `features` / `resolution` / `check_alignment`, with `features`
            taking `Feature` objects), a **dict** with the same keys (see
            `GeoMixin._draw_basemap`), or a **callable** ``f(glyph)`` for
            full control. On a value-linked-opacity `style` (e.g.
            `temperature_flame`) the cool areas reveal the terrain while the
            data glows on top. Drawing the relief needs the `[tiles]` extra
            (Pillow).
        colorbar: Colorbar presence and placement. `None` (default) keeps
            matplotlib's placement (honouring the legacy `add_colorbar`);
            `False` draws no colorbar; `True` a default one. Pass a
            `ColorBar` for control -- an edge (`location`), an `inside`
            inset that tracks `full_bleed`, a backing `box` (defaulted on
            for an inset), and text colours (`label_color` for the title,
            `tick_color` for the tick numbers). Same flag as `plot(colorbar=)`.
            On a `style=` preset, a placement `ColorBar` (or `True`) overrides
            the swatch with a real colorbar; a colours-only `ColorBar` styles
            the swatch in place (defaults < preset < explicit).
        compose: Draw *over* whatever is already on `ax` instead of
            replacing it, leaving another glyph's layers, colorbar, title
            and ticks intact. Off by default, where a render replaces every
            glyph's artists on the axes (see issue #210). Same flag as
            `plot(compose=)`, including the colorbar default: a composed
            animation draws none of its own unless the caller asks with
            `colorbar=` or `add_colorbar=True`, so the host keeps the
            geometry it had.
        **kwargs: Additional keyword arguments for customizing the animation.

            Plot appearance:
                title : str, optional
                    Title of the plot, by default 'Array Plot'.
                title_size : int, optional
                    Title font size, by default 15.
                cmap : str or matplotlib.colors.Colormap, optional
                    Colormap, by default 'coolwarm_r'. A plain matplotlib
                    name (e.g. 'viridis') or a `Colormap` object is used
                    as-is; a **namespaced** name such as 'cmocean:thermal'
                    or 'cmasher:ember' is resolved via the optional `cmap`
                    aggregator — install the `[science-colors]` extra
                    (`pip install cleopatra[science-colors]`). The `_r`
                    reverse suffix works on both forms.
                vmin : float, optional
                    Minimum value for color scaling, by default min(array).
                vmax : float, optional
                    Maximum value for color scaling, by default max(array).

            Color bar options:
                add_colorbar : bool, optional
                    Whether to draw the glyph's own color bar, by
                    default True -- except under `compose=True`, which
                    defaults it off so the animation does not take space
                    from the host axes; passing it there (`True` or
                    `False`) still decides the matter. With it off
                    `self.cbar` stays None, no axes space is taken by a
                    color bar, and the mappable is still reachable via
                    `self.im`.
                cbar_orientation : str, optional
                    Prefer `colorbar=ColorBar(orientation=...)`.
                    Orientation of the color bar, by default 'vertical'.
                    Can be 'horizontal' or 'vertical'.
                cbar_label_rotation : float, optional
                    Prefer `colorbar=ColorBar(label_rotation=...)`.
                    Rotation angle (degrees) of the color bar label, by
                    default None (matplotlib's own label orientation).
                cbar_label_location : str, optional
                    Prefer `colorbar=ColorBar(label_location=...)`.
                    Location of the color bar label, by default 'center'.
                    Valid values depend on the bar orientation -- vertical:
                    'top'/'center'/'bottom'; horizontal: 'left'/'center'/'right'.
                cbar_length : float, optional
                    Prefer `colorbar=ColorBar(length=...)`. Ratio to
                    control the height/width of the color bar, by default 0.75.
                ticks_spacing : int, optional
                    Prefer `colorbar=ColorBar(ticks_spacing=...)`.
                    Spacing between ticks on the color bar, by default 5.
                cbar_label_size : int, optional
                    Prefer `colorbar=ColorBar(label_size=...)`. Font
                    size of the color bar label, by default 12.
                cbar_label : str, optional
                    Prefer `colorbar=ColorBar(label=...)`. Label text
                    for the color bar, by default None.

            Grouped options (moved off `**kwargs`):
                The colour-scale options (`color_scale`, `gamma`,
                `line_threshold`, `line_scale`, `bounds`, `midpoint`)
                move to `color=ColorScaling(...)`; the per-cell value
                text (`display_cell_value`, `num_size`,
                `background_color_threshold`) moves to
                `cells=CellValues(...)`; the named preset and relief
                shading (`style`, `hillshade`) move to
                `data_style=DataStyle(...)`. See
                `cleopatra.styling.scaling.ColorScaling` and
                `cleopatra.styling.params`. Passing any of them as a
                loose keyword raises with a pointer to the object.

                precision : int, optional
                    Decimal places each frame's cell value text is
                    rounded to, by default 2. `animate`-only, and still
                    a loose keyword (not part of `CellValues`).

    Returns:
        matplotlib.animation.FuncAnimation: The animation object that can be displayed
            in a notebook or saved to a file.

        As with `plot`, the first-frame colour-mapped artist is stored on
        the instance as `self.im` (and the colorbar, when drawn, on
        `self.cbar`), so a caller can attach a host-owned
        colorbar/legend without scraping the axes.

    Raises:
        ValueError: If an invalid keyword argument is provided.
        ValueError: If the length of the time list doesn't match the first dimension of the array.
        ValueError: If `data_getter` is None and `self.arr` is
            neither a 3-D `(time, rows, cols)` nor a 4-D
            `(time, rows, cols, 3|4)` array (no time axis to
            iterate over).
        ValueError: If `data_getter` is set and a returned frame's
            spatial dims do not match `self.arr.shape[-2:]`.

    Notes:
        The animation is created by iterating through the first dimension of the array.
        For example, if the array has shape (10, 20, 30), the animation will have 10 frames,
        each showing a 20x30 slice of the array.

        This method does not call `plt.show()`; it returns the `FuncAnimation` so the
        caller controls display. In an interactive (non-notebook) session call
        `plt.show()` yourself to play it, or use `save_animation` to write it to a file.

        To display the animation in a Jupyter notebook, you may need to use:
        ```python
        from IPython.display import HTML
        HTML(anim_obj.to_jshtml())
        ```

        To save the animation to a file, use the `save_animation` method after creating
        the animation.

    Examples:
    Basic animation from a 3D array:
    ```python
    >>> import numpy as np
    >>> from cleopatra.glyphs.gridded.array_glyph import ArrayGlyph
    >>> # Create a 3D array with 5 frames, each 10x10
    >>> arr = np.random.randint(1, 10, size=(5, 10, 10))
    >>> # Create labels for each frame
    >>> frame_labels = ["Frame 1", "Frame 2", "Frame 3", "Frame 4", "Frame 5"]
    >>> # Create the ArrayGlyph object
    >>> animated_array = ArrayGlyph(arr, figsize=(8, 8), title="Animated Array")
    >>> # Create the animation
    >>> anim_obj = animated_array.animate(frame_labels)

    ```
    Animation with custom interval (speed):
    ```python
    >>> animated_array = ArrayGlyph(arr, figsize=(8, 8), title="Animated Array")
    >>> # Slower animation (500ms between frames)
    >>> anim_obj = animated_array.animate(frame_labels, playback=Animation(interval=500))
    >>> animated_array = ArrayGlyph(arr, figsize=(8, 8), title="Animated Array")
    >>> # Faster animation (100ms between frames)
    >>> anim_obj = animated_array.animate(frame_labels, playback=Animation(interval=100))

    ```
    Animation with points:
    ```python
    >>> # Create a styled point overlay to display on the animation
    >>> from cleopatra.glyphs.gridded.array_glyph import PointOverlay
    >>> overlay = PointOverlay(
    ...     np.array([[1, 2, 3], [2, 5, 5], [3, 8, 8]]),
    ...     color="black",
    ...     size=150,
    ...     label_color="white",
    ...     label_size=12,
    ... )
    >>> animated_array = ArrayGlyph(arr, figsize=(8, 8), title="Animated Array")
    >>> anim_obj = animated_array.animate(frame_labels, points=overlay)

    ```
    Animation with cell values displayed:
    ```python
    >>> animated_array = ArrayGlyph(arr, figsize=(8, 8), title="Animated Array")
    >>> anim_obj = animated_array.animate(
    ...     frame_labels,
    ...     cells=CellValues(show=True, size=10),
    ...     playback=Animation(cell_value_text_colors=("yellow", "blue")),
    ... )

    ```
    ![animated_array](./../images/array_glyph/animated_array.gif)

    Saving the animation to a file:
    ```python
    >>> # Create the animation first
    >>> animated_array = ArrayGlyph(arr, figsize=(8, 8), title="Animated Array")
    >>> anim_obj = animated_array.animate(frame_labels)
    >>> # Then save it to a file
    >>> animated_array.save_animation("animation.gif", fps=2)

    ```
    Lazy frame streaming via `data_getter` (the callback supplies
    frame `i` on demand — useful for NetCDF time slabs or any
    source where eager loading is too expensive). The data array
    on the glyph acts as a shape template; only its last two axes
    are read.
    ```python
    >>> import numpy as np
    >>> from cleopatra.glyphs.gridded.array_glyph import ArrayGlyph
    >>> template = np.arange(36, dtype=float).reshape(1, 6, 6)
    >>> glyph = ArrayGlyph(template, figsize=(4, 4), title="Lazy")
    >>> labels = ["t0", "t1", "t2"]
    >>> def get_frame(i):
    ...     return np.full((6, 6), float(i)) + np.arange(36).reshape(6, 6)
    >>> anim_obj = glyph.animate(labels, playback=Animation(data_getter=get_frame))
    >>> anim_obj._fig is glyph.fig
    True

    ```
    True-colour animation from a 4-D `(time, rows, cols, 3)` RGB stack.
    Each frame is drawn as true colour, so no colorbar is created
    (`glyph.cbar` stays `None`):
    ```python
    >>> import numpy as np
    >>> from cleopatra.glyphs.gridded.array_glyph import ArrayGlyph
    >>> rgb_stack = np.linspace(0.0, 1.0, 3 * 6 * 6 * 3).reshape(3, 6, 6, 3)
    >>> glyph = ArrayGlyph(rgb_stack, figsize=(4, 4), title="RGB")
    >>> anim_obj = glyph.animate(["t0", "t1", "t2"])
    >>> glyph.cbar is None
    True

    ```
    Full-bleed layout: no chrome (ticks/spines) and the axes taking the whole
    figure. `full_bleed=True` leaves the canvas colour alone; pass a colour
    (`full_bleed="black"`) to also paint it, so masked cells read dark:
    ```python
    >>> import numpy as np
    >>> from cleopatra.glyphs.gridded.array_glyph import ArrayGlyph
    >>> stack = np.arange(3 * 6 * 8, dtype=float).reshape(3, 6, 8)
    >>> glyph = ArrayGlyph(stack, extent=[0, 0, 8, 6])
    >>> anim_obj = glyph.animate(
    ...     ["t0", "t1", "t2"], full_bleed="black", add_colorbar=False
    ... )
    >>> tuple(round(float(v), 3) for v in glyph.ax.get_position().bounds)
    (0.0, 0.0, 1.0, 1.0)
    >>> glyph.ax.get_facecolor()
    (0.0, 0.0, 0.0, 1.0)

    ```
    Compose a reference basemap under the frames (`basemap=True`) -- relief
    below, coastline and borders over. The `animate` call is `+SKIP`ped in
    doctest because it downloads the `[tiles]` assets on first use:
    ```python
    >>> import numpy as np
    >>> from cleopatra.glyphs.gridded.array_glyph import ArrayGlyph
    >>> stack = np.arange(3 * 20 * 30, dtype=float).reshape(3, 20, 30)
    >>> glyph = ArrayGlyph(stack, extent=[-12, 34, 32, 64])
    >>> anim_obj = glyph.animate(  # doctest: +SKIP
    ...     ["t0", "t1", "t2"], basemap=True, full_bleed=True, add_colorbar=False
    ... )

    ```
    """
    playback = playback or Animation()
    cell_value_text_colors = playback.cell_value_text_colors
    interval = playback.interval
    data_getter = playback.data_getter
    frame_label = playback.frame_label or FrameLabel()

    self._warn_norm_shadows_scale(color, kwargs.get("norm"))
    pre_group_opts = self._snapshot_group_options(
        color, contour, cells, classify, data_style
    )
    self._merge_group_params(color, contour, cells, classify, data_style)
    resolved_colorbar = self._apply_kwargs_and_colorbar(colorbar, kwargs)  # type: ignore[arg-type]

    if "ticks_spacing" not in resolved_colorbar:
        if "ticks_spacing" in kwargs.keys():
            self.default_options["ticks_spacing"] = kwargs["ticks_spacing"]
        else:
            self.default_options["ticks_spacing"] = self.ticks_spacing

    self._vmin_explicit = self._vmin_explicit or "vmin" in kwargs
    if "vmin" in kwargs.keys():
        self.default_options["vmin"] = kwargs["vmin"]
    else:
        self.default_options["vmin"] = self._log_floored_vmin(
            self.arr,
            self.vmin,
            vmin_pinned=self._vmin_explicit,
            ticks_spacing_pinned=(
                "ticks_spacing" in kwargs or "ticks_spacing" in resolved_colorbar
            ),
        )

    if "vmax" in kwargs.keys():
        self.default_options["vmax"] = kwargs["vmax"]
    else:
        self.default_options["vmax"] = self.vmax

    precision = self.default_options["precision"]
    array = self.arr

    def _is_rgb_frame(frame: np.ndarray) -> bool:
        return frame.ndim == 3 and frame.shape[-1] in (3, 4)

    if data_getter is None:
        if array.ndim == 4 and array.shape[-1] in (3, 4):
            # 4-D true-colour stack: (time, rows, cols, 3|4).
            frame_0 = array[0]
            n_frames = array.shape[0]
        elif array.ndim == 3:
            # 3-D single-band stack: (time, rows, cols).
            frame_0 = array[0, :, :]
            n_frames = array.shape[0]
        else:
            raise ValueError(
                "animate requires a 3-D (time, rows, cols) or 4-D "
                "(time, rows, cols, 3|4) array, or a data_getter callback"
            )
    else:
        n_frames = len(time)
        frame_0 = np.asarray(data_getter(0))
        expected_hw = tuple(array.shape[-2:])
        actual_hw = frame_0.shape[:2] if _is_rgb_frame(frame_0) else frame_0.shape
        if actual_hw != expected_hw:
            raise ValueError(
                f"`data_getter` returned shape {frame_0.shape}, whose "
                f"spatial dims {actual_hw} do not match the data array's "
                f"last two axes {expected_hw}."
            )

    rgb_frames = _is_rgb_frame(frame_0)
    show_cell_value = self.default_options["display_cell_value"] and not rgb_frames

    if self.fig is None:
        self.fig, self.ax = self.create_figure_axes()
    elif self.ax is None:
        # A figure was bound without an axes: draw into the caller's figure.
        self.ax = self.fig.axes[0] if self.fig.axes else self.fig.add_subplot(111)
        self._auto_figure = False
        self._owns_figure = False

    fig, ax = self.fig, self.ax

    style_render: Any = None
    style_categorical = False

    if rgb_frames:
        _clear_prior_render_artists(ax, self, compose=compose)
        im = ax.imshow(frame_0, extent=self.extent)
        self.im = im
        self.cbar = None
    else:
        ticks = self.get_ticks()
        # Resolve the norm ONCE here, before any axes mutation: it surfaces a
        # bad `color_scale` / `scheme` (rolling the group merge back so a
        # failed classified animation leaves no half-applied option), emits
        # any scheme/scale conflict warning exactly once attributed to the
        # caller's `animate(...)`, and is handed to the render site so
        # classification is not recomputed. A named scheme bins the whole
        # stack (`_scale_values`), so every frame shares one set of classes.
        try:
            norm, cbar_kw, ticks = self._norm_cbar_and_ticks(ticks)
        except (ValueError, TypeError):
            for key, value in pre_group_opts.items():
                self.default_options[key] = value
            raise
        _clear_prior_render_artists(ax, self, compose=compose)
        im, cbar_kw = self._plot_im_get_cbar_kw(ax, frame_0, norm, cbar_kw, ticks)
        self.im = im

        self.cbar = None
        if self._draws_own_colorbar(compose, colorbar):
            self.cbar = self.create_color_bar(ax, im, cbar_kw)

        frame_0_scalar = np.asarray(
            ma.filled(ma.asarray(frame_0).astype(float), np.nan), dtype=float
        )
        style = self.default_options.get("style")
        if style is not None:
            if points is not None or show_cell_value:
                warnings.warn(
                    "data-style presets bypass point and cell-value "
                    "overlays; 'points' and 'display_cell_value' are ignored "
                    "with 'style'.",
                    stacklevel=2,
                )
                points = None
                show_cell_value = False
            if self.default_options.get("scheme") is not None:
                warnings.warn(
                    "a data-style preset owns the colour mapping, so 'classify' "
                    "is ignored with 'style'; drop 'data_style' to draw the "
                    "classified field.",
                    stacklevel=2,
                )
            layer = self._resolve_style_layer(style)
            cfg = {
                **DATA_STYLES[style][layer],
                **resolve_style_overrides(self._style_color_overrides),
            }
            self._apply_style_background(cfg)
            hillshade_active = (
                resolve_hillshade(self.default_options.get("hillshade")) is not None
            )
            categories = cfg.get("categories")
            if categories is not None:
                style_categorical = True
                if hillshade_active:
                    warnings.warn(
                        "hillshade is not composed with a categorical "
                        "data-style preset; the preset is applied and "
                        "hillshade ignored.",
                        stacklevel=2,
                    )
                cats = sorted(categories, key=lambda c: c[0])
                cat_values = np.array([float(c[0]) for c in cats])
                cat_colors = [c[1] for c in cats]
                cat_labels = [c[2] for c in cats]
                cat_cmap = ListedColormap(cat_colors)
                cat_norm = BoundaryNorm(
                    category_boundaries(list(cat_values)), len(cat_colors)
                )
                if self.cbar is not None:
                    self.cbar.remove()
                    self.cbar = None
                im.set_data(frame_0_scalar)
                im.set_cmap(cat_cmap)
                im.set_norm(cat_norm)
                if self._draws_own_colorbar(compose, colorbar):
                    disjoint_legend(
                        ax,
                        cat_colors,
                        cat_labels,
                        title=cfg["label"],
                        loc="upper right",
                    )
                style_render = ("categorical", cat_cmap, cat_norm, cat_values)
            else:
                stack = array if data_getter is None else frame_0
                style_norm, style_vmin, style_vmax = resolve_style_norm(
                    np.asarray(
                        ma.filled(ma.asarray(stack).astype(float), np.nan),
                        dtype=float,
                    ),
                    cfg,
                )
                style_cmap = resolve_colormap(cfg["cmap"])
                im.set_data(frame_0_scalar)
                im.set_cmap(style_cmap)
                im.set_norm(style_norm)
                if self.cbar is not None:
                    self.cbar.remove()
                    self.cbar = None
                if self._style_wants_colorbar:
                    insets = list(ax.child_axes)
                    for _inset in insets:
                        _inset.remove()
                    mappable = ScalarMappable(norm=style_norm, cmap=style_cmap)
                    mappable.set_array([])
                    self.cbar = self.create_color_bar(
                        ax, mappable, self._style_cbar_kw(style_norm)
                    )
                elif self._draws_own_colorbar(compose, colorbar):
                    insets = list(ax.child_axes)
                    for _inset in insets:
                        _inset.remove()
                    vmin_prefix, vmax_prefix = swatch_extend_prefixes(style_norm)
                    swatch_legend(
                        ax,
                        style_cmap,
                        cfg["label"],
                        vmin=style_vmin,
                        vmax=style_vmax,
                        norm=style_norm,
                        vmin_prefix=vmin_prefix,
                        vmax_prefix=vmax_prefix,
                        bounds=(0.02, 0.92, 0.32, 0.06),
                        text_color=self.default_options.get("cbar_label_color")
                        or _swatch_text_default(
                            self.default_options.get("cbar_box")
                        ),
                        value_color=self.default_options.get("cbar_tick_color")
                        or _swatch_text_default(
                            self.default_options.get("cbar_box")
                        ),
                        box=self.default_options.get("cbar_box"),
                    )
                alpha_vmin = cfg.get("alpha_vmin")
                alpha_vmax = cfg.get("alpha_vmax")
                style_alpha_norm = (
                    Normalize(vmin=alpha_vmin, vmax=alpha_vmax)
                    if alpha_vmin is not None or alpha_vmax is not None
                    else None
                )
                style_render = (
                    "continuous",
                    style_cmap,
                    style_norm,
                    style_alpha_norm,
                    cfg.get("alpha"),
                )

    # A composed animation adds a layer to someone else's axes: retitling it
    # or stripping its ticks is the host's business, not ours.
    if not compose or self.default_options["title"]:
        ax.set_title(
            self.default_options["title"],
            fontsize=self.default_options["title_size"],
            pad=_multiline_title_pad(
                ax,
                self.default_options["title"],
                self.default_options["title_size"],
            ),
        )
    # Row/column indices are meaningless axis labels, so a pixel-space
    # animation hides them -- the same rule `plot` applies. An animation
    # given an `extent` has real coordinates to show, and until now had them
    # blanked anyway, which quietly made `xtick_font_size` and
    # `ytick_font_size` inert on this path.
    if not compose and self.extent is None:
        ax.set_xticklabels([])
        ax.set_yticklabels([])

        ax.set_xticks([])
        ax.set_yticks([])

    self._apply_axis_style(ax)

    cell_text_value: list = []
    if show_cell_value:
        indices = get_indices2(frame_0, [np.nan])
        cell_text_value = self._plot_text(
            ax, frame_0, indices, self.default_options
        )
        indices = np.array(indices)

    points_scatter = None
    points_id: list = []
    if points is not None:
        row, col, points_scatter, points_id = points.draw(ax)

    background_color_threshold = None
    if not rgb_frames:
        if self.default_options["background_color_threshold"] is not None:
            background_color_threshold = im.norm(
                self.default_options["background_color_threshold"]
            )
        else:
            ref_for_threshold = array if data_getter is None else frame_0
            background_color_threshold = im.norm(np.nanmax(ref_for_threshold)) / 2.0

    day_text = frame_label.draw(ax, self.default_options["cbar_label_size"])
    self._day_text = day_text

    def _fetch_frame(i: int) -> np.ndarray:
        """Resolve frame `i` for the animation step.

        Routes between the eager `self.arr[i]` path and the lazy
        `data_getter(i)` callback added in CLEO-7. The frame's
        spatial dims (its first two axes) must always match
        `self.arr.shape[-2:]`; the callback variant re-validates
        per call to catch upstream shape drift (e.g. a NetCDF slab
        that changed size between frames).

        Args:
            i: Zero-based frame index. Must be a valid index into
                the time axis (`0 <= i < n_frames`).

        Returns:
            np.ndarray: The frame for index `i` — a 2-D single-band
                array, or a `(rows, cols, 3|4)` RGB / RGBA array —
                whose spatial dims equal `self.arr.shape[-2:]`.

        Raises:
            ValueError: If `data_getter` is set and the callback
                returns a frame whose spatial dims do not match
                `self.arr.shape[-2:]`.
        """
        if data_getter is None:
            frame = array[i] if rgb_frames else array[i, :, :]
        else:
            frame = np.asarray(data_getter(i))
            expected_hw = tuple(array.shape[-2:])
            actual_hw = frame.shape[:2] if _is_rgb_frame(frame) else frame.shape
            if actual_hw != expected_hw:
                raise ValueError(
                    f"`data_getter` returned shape {frame.shape}, whose "
                    f"spatial dims {actual_hw} do not match {expected_hw}."
                )
        return np.asarray(frame)

    hillshade_opts = resolve_hillshade(self.default_options.get("hillshade"))
    if style_categorical:
        hillshade_opts = None

    def _display_frame(frame):
        """Return the frame's image data: preset RGBA, relief-shaded, or raw."""
        if style_render is not None:
            filled = np.asarray(
                ma.filled(ma.asarray(frame).astype(float), np.nan), dtype=float
            )
            if style_render[0] == "categorical":
                _, cat_cmap, cat_norm, cat_values = style_render
                masked = np.where(np.isin(filled, cat_values), filled, np.nan)
                rgba = np.asarray(cat_cmap(cat_norm(masked)), dtype=float)
                rgba[~np.isfinite(masked)] = 0.0
                return rgba
            _, cmap_, norm_, alpha_norm_, const_ = style_render
            rgba = alpha_rgba(filled, cmap_, norm_, alpha_norm_, const_)
            if hillshade_opts is not None:
                rgba = shade_rgb(rgba, filled, **hillshade_opts)
            return rgba
        if hillshade_opts is not None and not rgb_frames:
            # Cast before filling: integer masked frames reject a NaN fill.
            elevation = np.asarray(
                ma.filled(ma.asarray(frame).astype(float), np.nan), dtype=float
            )
            return shade_grid(elevation, im.cmap, norm=im.norm, **hillshade_opts)
        return frame

    def init():
        """initialize the plot with the cached first frame"""
        im.set_data(_display_frame(frame_0))
        day_text.set_text("")
        output = [im, day_text]

        if points is not None:
            scatter = cast(PathCollection, points_scatter)  # set when points given
            scatter.set_offsets(np.c_[col, row])
            output.append(scatter)
            update_points = lambda x: points_id[x].set_text(points.points[x, 0])
            list(map(update_points, range(len(col))))

            output += points_id

        if show_cell_value:
            vals = frame_0[indices[:, 0], indices[:, 1]]
            update_cell_value = lambda x: cell_text_value[x].set_text(vals[x])
            list(map(update_cell_value, range(len(cell_text_value))))
            output += cell_text_value

        return output

    def animate_a(i):
        """plot for each element in the iterable."""
        frame = _fetch_frame(i)
        im.set_data(_display_frame(frame))
        day_text.set_text("Date = " + str(time[i])[0:10])
        output = [im, day_text]

        if points is not None:
            scatter = cast(PathCollection, points_scatter)  # set when points given
            scatter.set_offsets(np.c_[col, row])
            output.append(scatter)

            for x in range(len(col)):
                points_id[x].set_text(points.points[x, 0])

            output += points_id

        if show_cell_value:
            vals = frame[indices[:, 0], indices[:, 1]]

            def update_cell_value(x):
                """Update cell value"""
                val = round(vals[x], precision)
                kw = {
                    "color": cell_value_text_colors[
                        int(im.norm(vals[x]) > background_color_threshold)
                    ]
                }
                cell_text_value[x].update(kw)
                cell_text_value[x].set_text(val)

            list(map(update_cell_value, range(len(cell_text_value))))

            output += cell_text_value

        return output

    if basemap is not None:
        self._draw_basemap(basemap)
    if full_bleed:
        self._apply_full_bleed(
            facecolor=full_bleed if isinstance(full_bleed, str) else None
        )
    else:
        plt.tight_layout()
        if getattr(self, "_auto_figure", False):
            self._tighten_figure()
    anim = FuncAnimation(
        fig,
        animate_a,
        init_func=init,
        frames=n_frames,
        interval=interval,
        blit=True,
    )
    self._anim = anim
    _mark_render_artists(
        ax,
        self,
        self.cbar,
        self.im,
        self._day_text,
        points_scatter,
        *points_id,
        *cell_text_value,
    )
    return anim

apply_colormap(cmap) #

Apply a matplotlib colormap to an array.

Create an RGB channel from the given array using the given colormap.

Parameters:

Name Type Description Default
cmap Colormap | str

colormap.

required

Returns:

Type Description
ndarray

np.ndarray: 8-bit array with the colormap applied.

Examples: - Create an array and instantiate the Array object:

>>> import numpy as np
>>> arr = np.array([[1, 2, 3], [4, 5, 6], [7, 8, 9]])
>>> array = ArrayGlyph(arr)
>>> rgb_array = array.apply_colormap("coolwarm_r")
>>> print(rgb_array) # doctest: +SKIP
[[[179   3  38]
  [221  96  76]
  [244 154 123]]
 [[244 196 173]
  [220 220 221]
  [183 207 249]]
 [[139 174 253]
  [ 96 128 232]
  [ 58  76 192]]]

>>> print(rgb_array.dtype)
uint8

Source code in src/cleopatra/glyphs/gridded/array_glyph.py
def apply_colormap(self, cmap: Colormap | str) -> np.ndarray:
    """Apply a matplotlib colormap to an array.

        Create an RGB channel from the given array using the given colormap.

    Args:
        cmap: colormap.

    Returns:
        np.ndarray: 8-bit array with the colormap applied.

    Examples:
    - Create an array and instantiate the `Array` object:
    ```python
    >>> import numpy as np
    >>> arr = np.array([[1, 2, 3], [4, 5, 6], [7, 8, 9]])
    >>> array = ArrayGlyph(arr)
    >>> rgb_array = array.apply_colormap("coolwarm_r")
    >>> print(rgb_array) # doctest: +SKIP
    [[[179   3  38]
      [221  96  76]
      [244 154 123]]
     [[244 196 173]
      [220 220 221]
      [183 207 249]]
     [[139 174 253]
      [ 96 128 232]
      [ 58  76 192]]]

    >>> print(rgb_array.dtype)
    uint8

    ```
    """
    colormap = resolve_colormap(cmap)
    normed_data = (self.arr - self.arr.min()) / (self.arr.max() - self.arr.min())
    colored = colormap(normed_data)
    return np.asarray((colored[:, :, :3] * 255).astype("uint8"))

apply_style(style, **kwargs) #

Apply a DATA_STYLES preset by name, re-rendering the glyph in place.

A discoverable wrapper over plot(style=...) for restyling an already-built glyph. It redraws in place on the glyph's own axes (clearing the previous render first), so apply_style takes full ownership of that axes -- do not use it on an axes shared with unrelated caller content. If the glyph was never plotted (or its figure was closed), it renders on a fresh figure. Extra keyword arguments (e.g. hillshade, add_colorbar) are forwarded to plot. The applied style is sticky (survives a later plain plot()); plot(style=None) clears it. Per-call render overrides are sticky the same way: the colour-scale keywords (vmin/vmax/center/cmap/extend) and the contour=/data_style= group fields (levels/bands/alpha/ alpha_range) captured on one call persist into later plot/animate calls on the same glyph until changed or cleared (pass the field as None) -- so an override set for one render (e.g. a contour=Contour(levels=...)) can carry into a later styled render on the same reused glyph.

Parameters:

Name Type Description Default
style str

A cleopatra.styling.colors.DATA_STYLES preset name (see sorted(cleopatra.styling.colors.DATA_STYLES)).

required
**kwargs Any

Forwarded to plot (e.g. hillshade). compose=True is the one keyword plot accepts that this method cannot: it clears the axes before redrawing, so composing onto what is already there is a contradiction and is rejected rather than silently dropped.

{}

Returns:

Type Description
tuple[Figure, Axes]

tuple[Figure, Axes]: The figure and axes drawn on.

Raises:

Type Description
ValueError

If style is unknown or names a multi-layer preset (raised by plot), or if compose=True is passed -- with a message pointing at the plot(data_style=DataStyle(style=...), ax=..., compose=True) call that does draw a styled layer over an existing axes.

Examples:

  • Restyle a rendered glyph by name:
    >>> import matplotlib
    >>> matplotlib.use("Agg")
    >>> import numpy as np
    >>> from cleopatra.glyphs.gridded.array_glyph import ArrayGlyph
    >>> glyph = ArrayGlyph(np.arange(60.0).reshape(6, 10))
    >>> _ = glyph.plot()
    >>> _ = glyph.apply_style("topography")
    >>> glyph.style
    'topography'
    
  • compose=True is refused, and the glyph keeps the style it had:
    >>> import matplotlib
    >>> matplotlib.use("Agg")
    >>> import numpy as np
    >>> from cleopatra.glyphs.gridded.array_glyph import ArrayGlyph
    >>> glyph = ArrayGlyph(np.arange(60.0).reshape(6, 10))
    >>> _ = glyph.apply_style("topography")
    >>> glyph.apply_style("bathymetry", compose=True)
    Traceback (most recent call last):
        ...
    ValueError: apply_style() re-renders in place and clears the axes first, ...
    >>> glyph.style
    'topography'
    
Source code in src/cleopatra/glyphs/gridded/array_glyph.py
def apply_style(self, style: str, **kwargs: Any) -> tuple[Figure, Axes]:
    """Apply a `DATA_STYLES` preset by name, re-rendering the glyph in place.

    A discoverable wrapper over `plot(style=...)` for restyling an
    already-built glyph. It redraws **in place** on the glyph's own axes
    (clearing the previous render first), so `apply_style` takes full
    ownership of that axes -- do not use it on an axes shared with unrelated
    caller content. If the glyph was never plotted (or its figure was
    closed), it renders on a fresh figure. Extra keyword arguments (e.g.
    `hillshade`, `add_colorbar`) are forwarded to `plot`. The applied style
    is **sticky** (survives a later plain `plot()`); `plot(style=None)`
    clears it. Per-call render overrides are sticky the same way: the
    colour-scale keywords (`vmin`/`vmax`/`center`/`cmap`/`extend`) and the
    `contour=`/`data_style=` group fields (`levels`/`bands`/`alpha`/
    `alpha_range`) captured on one call persist into later `plot`/`animate`
    calls on the same glyph until changed or cleared (pass the field as
    `None`) -- so an override set for one render (e.g. a
    `contour=Contour(levels=...)`) can carry into a later styled render on
    the same reused glyph.

    Args:
        style: A `cleopatra.styling.colors.DATA_STYLES` preset name (see
            `sorted(cleopatra.styling.colors.DATA_STYLES)`).
        **kwargs: Forwarded to `plot` (e.g. `hillshade`). `compose=True` is
            the one keyword `plot` accepts that this method cannot: it
            clears the axes before redrawing, so composing onto what is
            already there is a contradiction and is rejected rather than
            silently dropped.

    Returns:
        tuple[Figure, Axes]: The figure and axes drawn on.

    Raises:
        ValueError: If `style` is unknown or names a multi-layer preset
            (raised by `plot`), or if `compose=True` is passed -- with a
            message pointing at the `plot(data_style=DataStyle(style=...),
            ax=..., compose=True)` call that does draw a styled layer over
            an existing axes.

    Examples:
        - Restyle a rendered glyph by name:
            ```python
            >>> import matplotlib
            >>> matplotlib.use("Agg")
            >>> import numpy as np
            >>> from cleopatra.glyphs.gridded.array_glyph import ArrayGlyph
            >>> glyph = ArrayGlyph(np.arange(60.0).reshape(6, 10))
            >>> _ = glyph.plot()
            >>> _ = glyph.apply_style("topography")
            >>> glyph.style
            'topography'

            ```
        - `compose=True` is refused, and the glyph keeps the style it had:
            ```python
            >>> import matplotlib
            >>> matplotlib.use("Agg")
            >>> import numpy as np
            >>> from cleopatra.glyphs.gridded.array_glyph import ArrayGlyph
            >>> glyph = ArrayGlyph(np.arange(60.0).reshape(6, 10))
            >>> _ = glyph.apply_style("topography")
            >>> glyph.apply_style("bathymetry", compose=True)
            Traceback (most recent call last):
                ...
            ValueError: apply_style() re-renders in place and clears the axes first, ...
            >>> glyph.style
            'topography'

            ```
    """
    resolve_single_layer_style(style)
    if kwargs.get("compose"):
        raise ValueError(
            "apply_style() re-renders in place and clears the axes first, so "
            "compose=True cannot be honoured here. To draw a styled layer "
            "over what is already on an axes, call "
            "plot(data_style=DataStyle(style=...), ax=..., compose=True)."
        )
    self._reset_axes_for_restyle()
    # Fold style (and an optional forwarded hillshade) into the grouped
    # data_style object; leaving hillshade unset keeps any sticky value.
    if "hillshade" in kwargs:
        data_style = DataStyle.for_apply_style(
            style, hillshade=kwargs.pop("hillshade")
        )
    else:
        data_style = DataStyle.for_apply_style(style)
    return self.plot(data_style=data_style, ax=self.ax, **kwargs)

create_figure_axes() #

Create the figure/axes, sizing the figure to the data when needed.

Overrides Glyph.create_figure_axes to use _auto_figsize whenever the caller left figsize at its default (did not pass it explicitly), so an equal-aspect map fills the figure instead of collapsing into a strip. An explicit figsize= is always honoured unchanged.

Returns:

Type Description
Figure

tuple[matplotlib.figure.Figure, matplotlib.axes.Axes]: The new figure

Axes

and axes.

Source code in src/cleopatra/glyphs/gridded/array_glyph.py
def create_figure_axes(self) -> tuple[Figure, Axes]:
    """Create the figure/axes, sizing the figure to the data when needed.

    Overrides `Glyph.create_figure_axes` to use `_auto_figsize` whenever the
    caller left `figsize` at its default (did not pass it explicitly), so an
    equal-aspect map fills the figure instead of collapsing into a strip. An
    explicit `figsize=` is always honoured unchanged.

    Returns:
        tuple[matplotlib.figure.Figure, matplotlib.axes.Axes]: The new figure
        and axes.
    """
    figsize = self.default_options["figsize"]
    auto = "figsize" not in getattr(self, "_explicit_options", set())
    if auto:
        figsize = self._auto_figsize()
    fig, ax = plt.subplots(figsize=figsize)
    self._owns_figure = True
    self._auto_figure = auto
    return fig, ax

facet(layout=None, *, kind='auto', colorbar=None, color=None, contour=None, cells=None, classify=None, data_style=None, compose=False, **kwargs) #

Render a grid of subplots from a 3-D or 4-D stack.

Mirrors xarray's xarray.plot.facetgrid.FacetGrid API. self.arr must be 3-D (N, H, W) when only col is set, or 4-D (N, M, H, W) when both col and row are set. All subplots share a common colour scale (vmin/vmax computed over the full stack unless the user passed explicit limits); each panel draws its own colour legend on that shared scale (a colour bar, or a preset style's swatch -- see colorbar= below), and result.cbar exposes the first panel's bar when one is drawn.

Spatial extent: every panel is a slice of the same array, so by default they all share the parent glyph's extent (one spatial domain — exactly like xarray's FacetGrid, which facets a single DataArray over a coordinate dimension). If your slices are same-shape grids covering different windows, pass extents — one [xmin, ymin, xmax, ymax] per panel. (If the slices are genuinely different datasets, build separate ArrayGlyph instances into your own plt.subplots grid instead.)

Parameters:

Name Type Description Default
layout FacetLayout | None

The facet grid layout, as a FacetLayout (see that class for the full field list). Bundles which dimension(s) to facet (col / row), optional col_wrap, per-panel labels, per-panel extents, and the drawing target: either a self-built figure sized by figure_size, or caller-supplied axes (a 2-D ndarray of shape (nrows, ncols), a nested / flat sequence of exactly nrows * ncols Axes, a Figure / SubFigure host, or a GridSpec / SubplotSpec region). figure_size and axes are mutually exclusive, and a supplied block must reproduce the (nrows, ncols) grid so col_wrap is honoured and FacetGrid.axes keeps that shape. With axes supplied cleopatra does not own the figure: it never tight_layouts or closes it, hides only the empty slots inside the block, and on a mid-render failure removes only the subplots it created on a host (a grid-spec host should be empty); caller-supplied pre-existing axes are left as they are, and plain matplotlib content on them is preserved. The shared colour scale and FacetGrid.fig (always the root Figure) are identical on every path.

None
kind str

Render kind, forwarded to the per-subplot dispatch. One of "auto", "imshow", "pcolormesh", "contour", "contourf". Default "auto".

'auto'
colorbar bool | ColorBar | None

The shared colour bar, mirroring plot / animate. None (default) keeps each panel's default colour legend -- a colour bar, or a preset style's swatch -- (the prior behaviour); False suppresses them (result.cbar is then None); True draws default ones, resetting the resettable cbar_* family to defaults so they do not inherit a prior sticky spec; a ColorBar applies its placement / caption / sizing to every panel (so the result.cbar returned -- the first panel's -- carries the spec). Prefer this typed form over the loose cbar_* kwargs, here as on plot / animate.

None
color ColorScaling | Normalize | None

Colour-scale group object forwarded to each panel's plot (cleopatra.styling.params.ColorScaling).

None
contour Contour | None

Contour/discretisation group object forwarded to each panel's plot (cleopatra.styling.params.Contour).

None
cells CellValues | None

Per-cell value-text group object forwarded to each panel's plot (cleopatra.styling.params.CellValues).

None
classify Classify | None

Value-classification group object (cleopatra.styling.params.Classify), by default None. A named scheme is resolved to its class edges once over the whole stack, so every panel shares one set of classes rather than re-binning its own slice; explicit edges are shared as-is.

None
data_style DataStyle | None

Named-preset / relief-shading group object forwarded to each panel's plot (cleopatra.styling.params.DataStyle).

None
compose bool

Forwarded to each panel's plot. Controls what a panel does with a prior cleopatra render already on its axes: False (default) clears it first (the replace-don't-orphan behaviour of plot), True draws the panel over it. Only cleopatra-drawn layers are affected -- plain matplotlib content the caller added (a basemap, graticule or frame) is left in place either way -- so pass compose=True when the supplied axes already carry a cleopatra layer (e.g. a relief drawn via cleopatra) you want kept beneath the panel. Two consequences: (1) like plot(compose=True), composing suppresses the per-panel colorbar by default, so result.cbar is None unless you also pass colorbar=True (or a ColorBar spec); (2) compose=True is only meaningful when there is a prior cleopatra layer to preserve -- on a self-built grid the axes are empty, so it just drops the colorbar for no benefit.

False
**kwargs

Forwarded to each subplot. Recognised keys include the same colour / colorbar / level kwargs as plot. vmin / vmax win over the stack-wide auto-computed limits. Prefer the typed colorbar over the loose cbar_* kwargs.

{}

Returns:

Name Type Description
FacetGrid FacetGrid

Result object exposing fig, axes, cbar, and name_dicts.

Raises:

Type Description
ValueError

If layout is omitted, if a layout keyword is passed loosely instead of on FacetLayout (e.g. facet(col=...)), if neither layout.col nor layout.row is given, if the array shape does not match the requested facet dimensions, if layout.labels lengths are wrong, if layout.extents is combined with the parent's extent / coords or has the wrong length or a non-length-4 element, or if a removed keyword is passed -- figsize or col_coords / row_coords. Also if layout.figure_size and layout.axes are both given, or layout.axes does not reproduce the (nrows, ncols) grid / holds non-Axes items / (for a grid-spec host) is not attached to a figure or is too small.

Examples:

  • Facet a 3-D stack into a 1xN row of subplots:
    >>> import numpy as np
    >>> from cleopatra.glyphs.gridded.array_glyph import (
    ...     ArrayGlyph,
    ...     FacetLayout,
    ... )
    >>> stack = np.arange(4 * 5 * 5, dtype=float).reshape(4, 5, 5)
    >>> g = ArrayGlyph(stack).facet(FacetLayout(col="t"))
    >>> g.axes.shape
    (1, 4)
    >>> g.name_dicts[0]
    {'t': 0}
    
  • Wrap N=6 panels into a 2x3 grid with col_wrap=3:
    >>> import numpy as np
    >>> from cleopatra.glyphs.gridded.array_glyph import (
    ...     ArrayGlyph,
    ...     FacetLayout,
    ... )
    >>> stack = np.arange(6 * 5 * 5, dtype=float).reshape(6, 5, 5)
    >>> g = ArrayGlyph(stack).facet(FacetLayout(col="t", col_wrap=3))
    >>> g.axes.shape
    (2, 3)
    
  • Title each panel with a coordinate label via PanelLabels:
    >>> import numpy as np
    >>> from cleopatra.glyphs.gridded.array_glyph import (
    ...     ArrayGlyph,
    ...     FacetLayout,
    ...     PanelLabels,
    ... )
    >>> stack = np.arange(3 * 5 * 5, dtype=float).reshape(3, 5, 5)
    >>> g = ArrayGlyph(stack).facet(
    ...     FacetLayout(
    ...         col="month",
    ...         labels=PanelLabels(col=["Jan", "Feb", "Mar"]),
    ...     )
    ... )
    >>> [d["month"] for d in g.name_dicts]
    ['Jan', 'Feb', 'Mar']
    
  • Per-panel extents for same-shape grids over different windows (one [xmin, ymin, xmax, ymax] per subplot):
    >>> import numpy as np
    >>> from cleopatra.glyphs.gridded.array_glyph import (
    ...     ArrayGlyph,
    ...     FacetLayout,
    ... )
    >>> stack = np.arange(2 * 4 * 4, dtype=float).reshape(2, 4, 4)
    >>> g = ArrayGlyph(stack).facet(
    ...     FacetLayout(
    ...         col="region",
    ...         extents=[[0, 0, 10, 10], [10, 0, 20, 10]],
    ...     )
    ... )
    >>> [tuple(int(v) for v in im.get_extent()) for im in
    ...  (ax.get_images()[0] for ax in g.axes.flat)]
    [(0, 10, 0, 10), (10, 20, 0, 10)]
    
  • Configure the shared colour bar with a typed ColorBar:
    >>> import numpy as np
    >>> from cleopatra.glyphs.gridded.array_glyph import (
    ...     ArrayGlyph,
    ...     FacetLayout,
    ... )
    >>> from cleopatra.styling.colorbar import ColorBar
    >>> stack = np.arange(3 * 5 * 5, dtype=float).reshape(3, 5, 5)
    >>> g = ArrayGlyph(stack).facet(
    ...     FacetLayout(col="t"), colorbar=ColorBar(label="mm")
    ... )
    >>> g.cbar.ax.get_ylabel()
    'mm'
    
  • Draw into axes the caller already created (and could decorate):
    >>> import matplotlib.pyplot as plt
    >>> import numpy as np
    >>> from cleopatra.glyphs.gridded.array_glyph import (
    ...     ArrayGlyph,
    ...     FacetLayout,
    ... )
    >>> stack = np.arange(3 * 5 * 5, dtype=float).reshape(3, 5, 5)
    >>> fig, axs = plt.subplots(1, 3, figsize=(9, 3), squeeze=False)
    >>> g = ArrayGlyph(stack).facet(FacetLayout(col="t", axes=axs))
    >>> g.fig is fig
    True
    >>> g.axes[0, 0] is axs[0, 0]
    True
    >>> plt.close(fig)
    
Source code in src/cleopatra/glyphs/gridded/array_glyph.py
4566
4567
4568
4569
4570
4571
4572
4573
4574
4575
4576
4577
4578
4579
4580
4581
4582
4583
4584
4585
4586
4587
4588
4589
4590
4591
4592
4593
4594
4595
4596
4597
4598
4599
4600
4601
4602
4603
4604
4605
4606
4607
4608
4609
4610
4611
4612
4613
4614
4615
4616
4617
4618
4619
4620
4621
4622
4623
4624
4625
4626
4627
4628
4629
4630
4631
4632
4633
4634
4635
4636
4637
4638
4639
4640
4641
4642
4643
4644
4645
4646
4647
4648
4649
4650
4651
4652
4653
4654
4655
4656
4657
4658
4659
4660
4661
4662
4663
4664
4665
4666
4667
4668
4669
4670
4671
4672
4673
4674
4675
4676
4677
4678
4679
4680
4681
4682
4683
4684
4685
4686
4687
4688
4689
4690
4691
4692
4693
4694
4695
4696
4697
4698
4699
4700
4701
4702
4703
4704
4705
4706
4707
4708
4709
4710
4711
4712
4713
4714
4715
4716
4717
4718
4719
4720
4721
4722
4723
4724
4725
4726
4727
4728
4729
4730
4731
4732
4733
4734
4735
4736
4737
4738
4739
4740
4741
4742
4743
4744
4745
4746
4747
4748
4749
4750
4751
4752
4753
4754
4755
4756
4757
4758
4759
4760
4761
4762
4763
4764
4765
4766
4767
4768
4769
4770
4771
4772
4773
4774
4775
4776
4777
4778
4779
4780
4781
4782
4783
4784
4785
4786
4787
4788
4789
4790
4791
4792
4793
4794
4795
4796
4797
4798
4799
4800
4801
4802
4803
4804
4805
4806
4807
4808
4809
4810
4811
4812
4813
4814
4815
4816
4817
4818
4819
4820
4821
4822
4823
4824
4825
4826
4827
4828
4829
4830
4831
4832
4833
4834
4835
4836
4837
4838
4839
4840
4841
4842
4843
4844
4845
4846
4847
4848
4849
4850
4851
4852
4853
4854
4855
4856
4857
4858
4859
4860
4861
4862
4863
4864
4865
4866
4867
4868
4869
4870
4871
4872
4873
4874
4875
4876
4877
4878
4879
4880
4881
4882
4883
4884
4885
4886
4887
4888
4889
4890
4891
4892
4893
4894
4895
4896
4897
4898
4899
4900
4901
4902
4903
4904
4905
4906
4907
4908
4909
4910
4911
4912
4913
4914
4915
4916
4917
4918
4919
4920
4921
4922
4923
4924
4925
4926
4927
4928
4929
4930
4931
4932
4933
4934
4935
4936
4937
4938
4939
4940
4941
4942
4943
4944
4945
4946
4947
4948
4949
4950
4951
4952
4953
4954
4955
4956
4957
4958
4959
4960
4961
4962
4963
4964
4965
4966
4967
4968
4969
4970
4971
4972
4973
4974
4975
4976
4977
4978
4979
4980
4981
4982
4983
4984
4985
4986
4987
4988
4989
4990
4991
4992
4993
4994
4995
4996
4997
4998
4999
5000
5001
5002
5003
5004
5005
5006
5007
5008
def facet(
    self,
    layout: FacetLayout | None = None,
    *,
    kind: str = "auto",
    colorbar: bool | ColorBar | None = None,
    color: ColorScaling | Normalize | None = None,
    contour: Contour | None = None,
    cells: CellValues | None = None,
    classify: Classify | None = None,
    data_style: DataStyle | None = None,
    compose: bool = False,
    **kwargs,
) -> FacetGrid:
    """Render a grid of subplots from a 3-D or 4-D stack.

    Mirrors xarray's `xarray.plot.facetgrid.FacetGrid` API.
    `self.arr` must be 3-D `(N, H, W)` when only `col` is set,
    or 4-D `(N, M, H, W)` when both `col` and `row` are set.
    All subplots share a common colour scale (`vmin`/`vmax`
    computed over the full stack unless the user passed explicit
    limits); each panel draws its own colour legend on that shared
    scale (a colour bar, or a preset style's swatch -- see `colorbar=`
    below), and `result.cbar` exposes the first panel's bar when one
    is drawn.

    Spatial extent: every panel is a slice of the *same* array, so by
    default they all share the parent glyph's `extent` (one spatial
    domain — exactly like xarray's `FacetGrid`, which facets a single
    `DataArray` over a coordinate dimension). If your slices are
    same-shape grids covering *different* windows, pass `extents` —
    one `[xmin, ymin, xmax, ymax]` per panel. (If the slices are
    genuinely different datasets, build separate `ArrayGlyph`
    instances into your own `plt.subplots` grid instead.)

    Args:
        layout: The facet grid layout, as a `FacetLayout` (see that class
            for the full field list). Bundles which dimension(s) to facet
            (`col` / `row`), optional `col_wrap`, per-panel `labels`,
            per-panel `extents`, and the drawing target: either a self-built
            figure sized by `figure_size`, or caller-supplied `axes` (a 2-D
            `ndarray` of shape `(nrows, ncols)`, a nested / flat sequence of
            exactly `nrows * ncols` `Axes`, a `Figure` / `SubFigure` host, or
            a `GridSpec` / `SubplotSpec` region). `figure_size` and `axes`
            are mutually exclusive, and a supplied block must reproduce the
            `(nrows, ncols)` grid so `col_wrap` is honoured and
            `FacetGrid.axes` keeps that shape. With `axes` supplied cleopatra
            does not own the figure: it never `tight_layout`s or closes it,
            hides only the empty slots inside the block, and on a mid-render
            failure removes only the subplots it created on a host (a
            grid-spec host should be empty); caller-supplied pre-existing
            axes are left as they are, and plain matplotlib content on them
            is preserved. The shared colour scale and `FacetGrid.fig`
            (always the root `Figure`) are identical on every path.
        kind: Render kind, forwarded to the per-subplot dispatch.
            One of `"auto"`, `"imshow"`, `"pcolormesh"`,
            `"contour"`, `"contourf"`. Default `"auto"`.
        colorbar: The shared colour bar, mirroring `plot` / `animate`.
            `None` (default) keeps each panel's default colour legend --
            a colour bar, or a preset style's swatch -- (the prior
            behaviour); `False` suppresses them (`result.cbar` is then
            `None`);
            `True` draws default ones, resetting the resettable `cbar_*`
            family to defaults so they do not inherit a prior sticky
            spec; a `ColorBar` applies its
            placement / caption / sizing to every panel (so the
            `result.cbar` returned -- the first panel's -- carries the
            spec). Prefer this typed form over the loose `cbar_*`
            kwargs, here as on `plot` / `animate`.
        color: Colour-scale group object forwarded to each panel's `plot`
            (`cleopatra.styling.params.ColorScaling`).
        contour: Contour/discretisation group object forwarded to each
            panel's `plot` (`cleopatra.styling.params.Contour`).
        cells: Per-cell value-text group object forwarded to each panel's
            `plot` (`cleopatra.styling.params.CellValues`).
        classify: Value-classification group object
            (`cleopatra.styling.params.Classify`), by default `None`. A
            named scheme is resolved to its class edges **once over the
            whole stack**, so every panel shares one set of classes rather
            than re-binning its own slice; explicit edges are shared as-is.
        data_style: Named-preset / relief-shading group object forwarded to
            each panel's `plot` (`cleopatra.styling.params.DataStyle`).

        compose: Forwarded to each panel's `plot`. Controls what a panel
            does with a **prior cleopatra render** already on its axes:
            `False` (default) clears it first (the replace-don't-orphan
            behaviour of `plot`), `True` draws the panel *over* it. Only
            cleopatra-drawn layers are affected -- plain matplotlib content
            the caller added (a basemap, graticule or frame) is left in place
            either way -- so pass `compose=True` when the supplied axes
            already carry a cleopatra layer (e.g. a relief drawn via
            cleopatra) you want kept beneath the panel. Two consequences:
            (1) like `plot(compose=True)`, composing **suppresses the
            per-panel colorbar by default**, so `result.cbar` is `None`
            unless you also pass `colorbar=True` (or a `ColorBar` spec);
            (2) `compose=True` is only meaningful when there is a prior
            cleopatra layer to preserve -- on a self-built grid the axes are
            empty, so it just drops the colorbar for no benefit.
        **kwargs: Forwarded to each subplot. Recognised keys
            include the same colour / colorbar / level kwargs as
            `plot`. `vmin` / `vmax` win over the
            stack-wide auto-computed limits. Prefer the typed
            `colorbar` over the loose `cbar_*` kwargs.

    Returns:
        FacetGrid: Result object exposing `fig`, `axes`,
            `cbar`, and `name_dicts`.

    Raises:
        ValueError: If `layout` is omitted, if a layout keyword is passed
            loosely instead of on `FacetLayout` (e.g. `facet(col=...)`), if
            neither `layout.col` nor `layout.row` is given, if the array
            shape does not match the requested facet dimensions, if
            `layout.labels` lengths are wrong, if `layout.extents` is
            combined with the parent's `extent` / `coords` or has the wrong
            length or a non-length-4 element, or if a removed keyword is
            passed -- `figsize` or `col_coords` / `row_coords`. Also if
            `layout.figure_size` and `layout.axes` are both given, or
            `layout.axes` does not reproduce the `(nrows, ncols)` grid /
            holds non-`Axes` items / (for a grid-spec host) is not attached
            to a figure or is too small.

    Examples:
        - Facet a 3-D stack into a 1xN row of subplots:
            ```python
            >>> import numpy as np
            >>> from cleopatra.glyphs.gridded.array_glyph import (
            ...     ArrayGlyph,
            ...     FacetLayout,
            ... )
            >>> stack = np.arange(4 * 5 * 5, dtype=float).reshape(4, 5, 5)
            >>> g = ArrayGlyph(stack).facet(FacetLayout(col="t"))
            >>> g.axes.shape
            (1, 4)
            >>> g.name_dicts[0]
            {'t': 0}

            ```
        - Wrap N=6 panels into a 2x3 grid with `col_wrap=3`:
            ```python
            >>> import numpy as np
            >>> from cleopatra.glyphs.gridded.array_glyph import (
            ...     ArrayGlyph,
            ...     FacetLayout,
            ... )
            >>> stack = np.arange(6 * 5 * 5, dtype=float).reshape(6, 5, 5)
            >>> g = ArrayGlyph(stack).facet(FacetLayout(col="t", col_wrap=3))
            >>> g.axes.shape
            (2, 3)

            ```
        - Title each panel with a coordinate label via `PanelLabels`:
            ```python
            >>> import numpy as np
            >>> from cleopatra.glyphs.gridded.array_glyph import (
            ...     ArrayGlyph,
            ...     FacetLayout,
            ...     PanelLabels,
            ... )
            >>> stack = np.arange(3 * 5 * 5, dtype=float).reshape(3, 5, 5)
            >>> g = ArrayGlyph(stack).facet(
            ...     FacetLayout(
            ...         col="month",
            ...         labels=PanelLabels(col=["Jan", "Feb", "Mar"]),
            ...     )
            ... )
            >>> [d["month"] for d in g.name_dicts]
            ['Jan', 'Feb', 'Mar']

            ```
        - Per-panel extents for same-shape grids over different
            windows (one `[xmin, ymin, xmax, ymax]` per subplot):
            ```python
            >>> import numpy as np
            >>> from cleopatra.glyphs.gridded.array_glyph import (
            ...     ArrayGlyph,
            ...     FacetLayout,
            ... )
            >>> stack = np.arange(2 * 4 * 4, dtype=float).reshape(2, 4, 4)
            >>> g = ArrayGlyph(stack).facet(
            ...     FacetLayout(
            ...         col="region",
            ...         extents=[[0, 0, 10, 10], [10, 0, 20, 10]],
            ...     )
            ... )
            >>> [tuple(int(v) for v in im.get_extent()) for im in
            ...  (ax.get_images()[0] for ax in g.axes.flat)]
            [(0, 10, 0, 10), (10, 20, 0, 10)]

            ```
        - Configure the shared colour bar with a typed `ColorBar`:
            ```python
            >>> import numpy as np
            >>> from cleopatra.glyphs.gridded.array_glyph import (
            ...     ArrayGlyph,
            ...     FacetLayout,
            ... )
            >>> from cleopatra.styling.colorbar import ColorBar
            >>> stack = np.arange(3 * 5 * 5, dtype=float).reshape(3, 5, 5)
            >>> g = ArrayGlyph(stack).facet(
            ...     FacetLayout(col="t"), colorbar=ColorBar(label="mm")
            ... )
            >>> g.cbar.ax.get_ylabel()
            'mm'

            ```
        - Draw into axes the caller already created (and could decorate):
            ```python
            >>> import matplotlib.pyplot as plt
            >>> import numpy as np
            >>> from cleopatra.glyphs.gridded.array_glyph import (
            ...     ArrayGlyph,
            ...     FacetLayout,
            ... )
            >>> stack = np.arange(3 * 5 * 5, dtype=float).reshape(3, 5, 5)
            >>> fig, axs = plt.subplots(1, 3, figsize=(9, 3), squeeze=False)
            >>> g = ArrayGlyph(stack).facet(FacetLayout(col="t", axes=axs))
            >>> g.fig is fig
            True
            >>> g.axes[0, 0] is axs[0, 0]
            True
            >>> plt.close(fig)

            ```
    """
    if "figsize" in kwargs:
        raise ValueError(
            "`figsize` is not a valid `facet` argument; it was renamed to "
            "`figure_size`. Pass `figure_size=(width, height)` instead."
        )
    if "col_coords" in kwargs or "row_coords" in kwargs:
        raise ValueError(
            "`col_coords` / `row_coords` are no longer valid `facet` "
            "arguments; pass panel-title labels via "
            "`labels=PanelLabels(col=..., row=...)` instead."
        )
    moved = [k for k in _FACET_LAYOUT_KEYS if k in kwargs]
    if moved:
        raise ValueError(
            f"{', '.join(moved)} moved onto FacetLayout; pass "
            f"`facet(FacetLayout({moved[0]}=...), ...)` instead of a loose "
            f"`{moved[0]}=` keyword."
        )
    if layout is None:
        raise ValueError(
            "`facet` requires a `FacetLayout`, e.g. "
            "`facet(FacetLayout(col='time'))`."
        )

    col = layout.col
    row = layout.row
    col_wrap = layout.col_wrap
    labels = layout.labels
    figure_size = layout.figure_size
    axes = layout.axes
    extents = layout.extents

    if col is None and row is None:
        raise ValueError("at least one of `col`/`row` must be given")
    labels = labels or PanelLabels()
    if extents is not None:
        if self.extent is not None:
            raise ValueError(
                "`extents` (per-panel) and the glyph's `extent` "
                "(one shared domain) are mutually exclusive."
            )
        if self._coords is not None:
            raise ValueError("`extents` and `coords` are mutually exclusive.")
        for k, e in enumerate(extents):
            if len(e) != 4:
                raise ValueError(
                    f"`extents[{k}]` must be a length-4 sequence "
                    f"[xmin, ymin, xmax, ymax], got {e!r}."
                )

    arr = self.arr
    if row is None:
        if arr.ndim != 3:
            raise ValueError(
                "Faceting on `col` alone requires a 3-D array "
                f"(N, H, W); got shape {arr.shape}."
            )
        n_col = arr.shape[0]
        if col_wrap is not None:
            if not isinstance(col_wrap, (int, np.integer)) or col_wrap < 1:
                raise ValueError(
                    f"`col_wrap` must be a positive int, got {col_wrap!r}."
                )
            ncols = int(col_wrap)
            nrows = int(ceil(n_col / ncols))
        else:
            ncols = n_col
            nrows = 1
        labels.validate(n_col)
        panel_indices: list[tuple[int, int | None]] = [
            (i, None) for i in range(n_col)
        ]
        n_panels = n_col
    else:
        if col is None:
            raise ValueError("Faceting on `row` requires `col` as well.")
        if arr.ndim != 4:
            raise ValueError(
                "Faceting on `row`+`col` requires a 4-D array "
                f"(Ncol, Nrow, H, W); got shape {arr.shape}."
            )
        n_col, n_row = arr.shape[0], arr.shape[1]
        ncols = n_col
        nrows = n_row
        labels.validate(n_col, n_row)
        panel_indices = [(i, j) for j in range(n_row) for i in range(n_col)]
        n_panels = n_col * n_row

    if extents is not None and len(extents) != n_panels:
        raise ValueError(
            f"`extents` has {len(extents)} entries but there are {n_panels} panels."
        )

    col = cast(str, col)  # guaranteed non-None by the validation above

    # Resolve the classification edges ONCE over the whole stack, so every
    # panel shares one set of classes instead of re-binning its own slice.
    # A named scheme is turned into an explicit edge sequence (used verbatim
    # by `classify`); explicit edges and `"categorical"` (rejected per
    # panel) pass through unchanged. Done *before* the figure is created so a
    # raising scheme (e.g. an all-non-finite stack) never leaks a figure.
    shared_classify = classify
    if (
        classify is not None
        and isinstance(classify.scheme, str)
        and classify.scheme != "categorical"
    ):
        edges, _ = classify_values(
            self._scale_values(), classify.scheme, classify.k or 5
        )
        shared_classify = Classify(
            scheme=[float(e) for e in edges],
            category_legend_kwargs=classify.category_legend_kwargs,
        )

    fig, axes_grid, flat_axes, owns_figure, created_axes = self._facet_axes(
        nrows, ncols, figure_size, axes
    )

    vmin_user = kwargs.get("vmin")
    vmax_user = kwargs.get("vmax")
    if vmin_user is None or vmax_user is None:
        if isinstance(arr, ma.MaskedArray):
            finite = arr.compressed()
        else:
            finite = np.asarray(arr).ravel()
        finite = finite[np.isfinite(finite)]
        if finite.size == 0:
            stack_min = 0.0
            stack_max = 1.0
        else:
            stack_min = float(finite.min())
            stack_max = float(finite.max())
        shared_vmin = stack_min if vmin_user is None else float(vmin_user)
        shared_vmax = stack_max if vmax_user is None else float(vmax_user)
    else:
        shared_vmin = float(vmin_user)
        shared_vmax = float(vmax_user)

    per_subplot_kwargs = dict(kwargs)
    per_subplot_kwargs["vmin"] = shared_vmin
    per_subplot_kwargs["vmax"] = shared_vmax

    name_dicts: list[dict[str, Any]] = []
    cbar: Colorbar | None = None

    try:
        for panel_idx, (col_idx, row_idx) in enumerate(panel_indices):
            ax = flat_axes[panel_idx]
            if row is None:
                panel_arr = arr[col_idx]
            else:
                panel_arr = arr[col_idx, row_idx]

            if extents is not None:
                sub_extent = list(extents[panel_idx])
            elif self.extent is None:
                sub_extent = None
            else:
                sub_extent = [
                    self.extent[0],  # xmin
                    self.extent[2],  # ymin
                    self.extent[1],  # xmax
                    self.extent[3],  # ymax
                ]
            sub = ArrayGlyph(
                panel_arr,
                coords=self._coords,
                extent=sub_extent,
                fig=fig,
                ax=ax,
                **per_subplot_kwargs,
            )
            # Route `colorbar=` through `plot` (not the constructor) so the
            # shared `_apply_kwargs_and_colorbar` logic runs per panel -- it
            # merges the resolved spec *over* any loose `cbar_*` already folded
            # into the sub-glyph's options and sets `_style_wants_colorbar`, so
            # a placement-bearing colorbar overrides a preset swatch here just
            # as it does on `plot` / `animate`.
            sub.plot(
                kind=kind,
                colorbar=colorbar,
                color=color,
                contour=contour,
                cells=cells,
                classify=shared_classify,
                data_style=data_style,
                compose=compose,
            )

            title, name_dict = labels.panel_title(col, col_idx, row, row_idx)
            ax.set_title(title)
            name_dicts.append(name_dict)

            if panel_idx == 0 and getattr(sub, "cbar", None) is not None:
                cbar = sub.cbar

        # Hide the empty slots -- only the ones inside the block we drew into
        # (every axis beyond the rendered panels), never the host's others.
        for hidden_ax in flat_axes[n_panels:]:
            hidden_ax.set_visible(False)

        # Only re-lay-out a figure cleopatra created; a caller's figure is
        # theirs to arrange.
        if owns_figure:
            fig.tight_layout()
    except Exception:
        # Roll back what cleopatra created: close a figure it owns; on a
        # caller's host, remove the subplots it added (but never touch
        # pre-existing axes the caller supplied).
        if owns_figure:
            plt.close(fig)
        elif created_axes:
            for panel_ax in flat_axes:
                panel_ax.remove()
        raise
    result = FacetGrid(fig=fig, axes=axes_grid, cbar=cbar, name_dicts=name_dicts)
    return result

plot(points=None, kind='auto', ax=None, title=None, color=None, contour=None, cells=None, classify=None, data_style=None, full_bleed=False, basemap=None, colorbar=None, compose=False, **kwargs) #

Plot the array with customizable visualization options.

This method creates a visualization of the array with various customization options including color scales, color bars, cell value display, and point annotations. It supports both regular arrays and RGB arrays.

Parameters:

Name Type Description Default
points PointOverlay | None

Points to display on the array, by default None. A PointOverlay bundling the (N, 3) array of [value, row, col] per point together with the marker / value-label styling (color / size / label_color / label_size).

None
kind str

Render kind, by default "auto". One of:

  • "auto" — picks the best renderer for the data. Routes to "pcolormesh" when curvilinear / non-uniform coords were passed to the constructor, otherwise falls back to "imshow".
  • "imshow" — pixel-grid raster render via ax.imshow/matshow. Honours extent. Incompatible with coords.
  • "pcolormesh" — quadrilateral mesh render via ax.pcolormesh with shading="auto". Honours coords (1-D centres or 2-D curvilinear).
  • "contour" — line contours via ax.contour. Honours levels from kwargs when set.
  • "contourf" — filled contours via ax.contourf. Honours levels from kwargs when set.

Cell-value display and point overlays only apply to "imshow" and "pcolormesh"; they are silently skipped for "contour" and "contourf" (which have no per-cell grid). RGB compositing requires kind="imshow".

'auto'
ax Axes | None

Target axes to draw on, by default None. When given, the plot is composed into this axes (and its parent figure, via ax.get_figure()), mirroring the other glyphs' plot(ax=...). Resolution priority is plot(ax=) > the axes bound at construction > an axes derived from a figure bound at construction > a fresh figure/axes. fig is intentionally not a parameter here — it is a construction-time binding derived from the axes.

None
title str | None

Plot title, by default None. A convenience shortcut equivalent to the title option; when given it overrides the title set at construction.

None
color ColorScaling | Normalize | None

Colour-scale group object (cleopatra.styling.scaling.ColorScaling) selecting the norm and its knobs, e.g. ColorScaling.power(gamma=0.7) or ColorScaling.boundary(bounds=[...]). Replaces the former loose color_scale / gamma / line_threshold / line_scale / bounds / midpoint keywords.

None
contour Contour | None

Contour/discretisation group object (cleopatra.styling.params.Contour), e.g. Contour(levels=5) or Contour(labels=True, label_kw={"fmt": "%.2f"}). Replaces the loose levels / labels / label_kw keywords.

None
cells CellValues | None

Per-cell value-text group object (cleopatra.styling.params.CellValues), e.g. CellValues(show=True, size=8). Replaces the loose display_cell_value / num_size / background_color_threshold keywords.

None
classify Classify | None

Value-classification group object (cleopatra.styling.params.Classify), by default None (a continuous colour scale). Bins the array's finite cells into discrete colour classes drawn with a stepped colorbar, e.g. Classify(scheme="quantiles", k=5), Classify(scheme="natural_breaks", k=7), or explicit edges Classify(scheme=[0, 10, 50, 100, 500]). The scheme owns the norm, so color's color_scale / levels are ignored when it is set (a warning says so), and the classes are derived from the data itself -- a caller vmin / vmax does not constrain them (pass explicit edges to pin the class boundaries instead). scheme="categorical" is rejected for a raster (its cells are a continuous field), so a Classify.category_legend_kwargs is accepted but has no effect here. A data_style preset owns the colour mapping outright, so classify is ignored when style is set (a warning says so).

None
data_style DataStyle | None

Named-preset / relief-shading group object (cleopatra.styling.params.DataStyle), e.g. DataStyle(style="dem", hillshade=True) or DataStyle(style="temperature_2m", bands=6, alpha=0.5). Replaces the loose style / hillshade keywords and the per-call preset overrides bands / alpha / alpha_range.

None
full_bleed bool | str

Fill the whole figure edge-to-edge with no surrounding margin, by default False. True hides ticks and spines and resizes the figure to the data box's aspect so the fill has no distortion, leaving the canvas colour untouched (masked / no-data cells keep the default background). Pass a colour string instead (e.g. "black") to also paint the canvas that colour -- e.g. so a semi-transparent relief reads dark. Same flag as animate(full_bleed=...). Intended for chrome-free maps -- a colorbar or title has no room, so pair it with add_colorbar=False and omit the title (an outside colorbar is otherwise left floating over the filled axes); a scale swatch (from style) still fits inside. It resizes the whole figure and gives its axes the entire canvas, so use a dedicated figure -- passing ax= one subplot of several lets full_bleed take over the figure and hide the siblings.

False
basemap bool | dict | Basemap | Callable[[Any], None] | None

A reference backdrop drawn via the glyph's own add_relief / add_features, composed by zorder (relief under the data, coastline/borders over it), by default None (no basemap). Accepts True for a sensible default (a "low" relief plus grey "50m" coastline and borders), a Basemap (the typed, validated form -- relief / features / resolution / check_alignment, with features taking Feature objects), a dict with the same keys (see GeoMixin._draw_basemap), or a callable f(glyph) for full control. Same flag as animate(basemap=...). On a projected axis, set self.crs first so the relief is warped to match the data. Drawing the relief needs the [tiles] extra (Pillow, and pyproj for a non-4326 crs).

None
compose bool

Draw over whatever is already on ax instead of replacing it, leaving another glyph's layers, colorbar and ticks intact, along with the host's title unless this glyph carries one of its own -- and, on a style= preset, the host's canvas colour and projection frame too. Off by default, where a render replaces every glyph's artists on the axes (see issue #210). Turn it on to lay one field over another. An overlay also draws no colorbar of its own by default: fig.colorbar() takes its space from the host axes, so a stack of overlays would re-lay-out the host once per layer. Pass colorbar= or add_colorbar=True (at construction or on the call) to get one anyway.

False
colorbar bool | ColorBar | None

Colorbar presence and placement. None (default) keeps matplotlib's placement (honouring the legacy add_colorbar); False draws no colorbar; True a default one. Under compose=True, passing anything but None here also counts as asking for the overlay's own colorbar, which is otherwise off. Pass a ColorBar for control -- an edge (location), an inside inset that tracks full_bleed, a backing box (defaulted on for an inset), and text colours (label_color for the title, tick_color for the tick numbers). Same flag as animate(colorbar=). On a style= preset, a placement ColorBar (or True) overrides the swatch with a real colorbar; a colours-only ColorBar styles the swatch in place (defaults < preset < explicit).

None
**kwargs Unpack[PlotKwargs]

Additional keyword arguments for customizing the plot.

Plot appearance: title : str, optional Title of the plot, by default 'Array Plot'. title_size : int, optional Title font size, by default 15. cmap : str or matplotlib.colors.Colormap, optional Colormap, by default 'coolwarm_r'. A plain matplotlib name (e.g. 'viridis') or a Colormap object is used as-is; a namespaced name such as 'cmocean:thermal' or 'cmasher:ember' is resolved via the optional cmap aggregator — install the [science-colors] extra (pip install cleopatra[science-colors]). The _r reverse suffix works on both forms. vmin : float, optional Minimum value for color scaling, by default min(array). vmax : float, optional Maximum value for color scaling, by default max(array).

Color bar options: add_colorbar : bool, optional Whether to draw the glyph's own color bar, by default True -- except under compose=True, which defaults it off so an overlay does not take space from the host axes; passing it there (True or False) still decides the matter. With it off self.cbar stays None, no axes space is taken by a color bar, and the mappable is still reachable via self.im. Note: for a constant-value field rendered as line contour there are no contour lines to map, so the color bar is skipped (with a warning) even when add_colorbar is True, and self.cbar stays None. cbar_orientation : str, optional Prefer colorbar=ColorBar(orientation=...). Orientation of the color bar, by default 'vertical'. Can be 'horizontal' or 'vertical'. cbar_label_rotation : float, optional Prefer colorbar=ColorBar(label_rotation=...). Rotation angle (degrees) of the color bar label, by default None (matplotlib's own label orientation). cbar_label_location : str, optional Prefer colorbar=ColorBar(label_location=...). Location of the color bar label, by default 'center'. Valid values depend on the bar orientation -- vertical: 'top'/'center'/'bottom'; horizontal: 'left'/'center'/'right'. cbar_length : float, optional Prefer colorbar=ColorBar(length=...). Ratio to control the height/width of the color bar, by default 0.75. ticks_spacing : int, optional Prefer colorbar=ColorBar(ticks_spacing=...). Spacing between ticks on the color bar, by default 5. cbar_label_size : int, optional Prefer colorbar=ColorBar(label_size=...). Font size of the color bar label, by default 12. cbar_label : str, optional Prefer colorbar=ColorBar(label=...). Label text for the color bar, by default None.

Colour scale (moved to the color= object): The colour-scale options (color_scale, gamma, line_threshold, line_scale, bounds, midpoint) and the discretisation levels are now set through the color= / contour= parameters -- see cleopatra.styling.scaling.ColorScaling and cleopatra.styling.params.Contour. Passing them as loose keywords raises with a pointer to the object.

Xarray-aligned colour kwargs: robust : bool, optional When True, use the 2nd and 98th percentile of the unmasked data for vmin / vmax, matching xarray's robust=True default. An explicit vmin / vmax always wins. By default False. center : float, optional Diverging-colormap centring value. When set, vmin / vmax are made symmetric around center (after robust has been applied), and the cmap auto-switches to "RdBu_r" if the caller did not pass an explicit cmap. By default None (no centring). extend : str, optional Colorbar arrow extension. One of "neither", "both", "min", "max", or None to auto-resolve ("both" when levels is set, otherwise "neither"). By default None. cbar_kwargs : dict, optional Extra keyword arguments forwarded to fig.colorbar. Merges over the defaults computed by cleopatra so user keys win on collision. Common keys: label, shrink, aspect, orientation, pad, ticks. By default None.

Contour / cell-value / data-style (moved to group objects): Contour labels (labels, label_kw) move to contour=Contour(...); per-cell value text (display_cell_value, num_size, background_color_threshold) moves to cells=CellValues(...); the named preset, relief shading, and the per-call preset overrides (style, hillshade, bands, alpha, alpha_range) move to data_style=DataStyle(...). See cleopatra.styling.params. Passing any of them as a loose keyword raises with a pointer to the object. A continuous data_style preset still composes with its hillshade; a categorical preset presents a discrete legend and is not shaded.

Other kwargs: projection : str, optional Draw the field on a projection preset: "globe" (orthographic) or "flat". Requires 1-D lon/lat coords=(lon, lat); the field is reprojected and, for "globe", the boundary + graticule are drawn. "globe" needs pyproj (the [tiles] extra). By default None (unprojected raster).

{}

Returns:

Type Description
Figure

tuple[matplotlib.figure.Figure, matplotlib.axes.Axes]: A tuple containing: - fig: The matplotlib Figure object - ax: The matplotlib Axes object

Axes

The colour-mapped artist (the ScalarMappable — e.g. the

tuple[Figure, Axes]

AxesImage for imshow, the QuadMesh for

tuple[Figure, Axes]

pcolormesh, the QuadContourSet for

tuple[Figure, Axes]

contour/contourf, or the RGB AxesImage) is also

tuple[Figure, Axes]

stored on the instance as self.im after this call, so a

tuple[Figure, Axes]

caller can attach a colorbar/legend or query the colour

tuple[Figure, Axes]

limits without scraping ax.images/ax.collections.

Raises:

Type Description
ValueError

If an invalid keyword argument is provided.

Notes

This method does not call plt.show(); it returns the Figure and Axes so the caller can compose, save, or display them. In an interactive session call plt.show() yourself (or fig.savefig(...) to write the plot to disk) after plot() returns.

Examples: - Basic array plot:

```python
>>> import numpy as np
>>> from cleopatra.glyphs.gridded.array_glyph import ArrayGlyph
>>> arr = np.array([[1, 2, 3], [4, 5, 6], [7, 8, 9]])
>>> array = ArrayGlyph(arr, figsize=(6, 6), title="Customized Plot", title_size=18)
>>> fig, ax = array.plot()

```
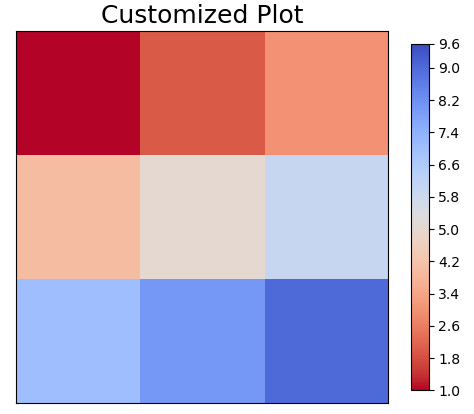
array-plot

  • Labelled line contours (kind="contour", labels=True):

    • inline numeric labels are drawn on the isolines and the label Text artists are kept on glyph.contour_labels:
      >>> from matplotlib.text import Text
      >>> y, x = np.mgrid[-3:3:30j, -3:3:30j]
      >>> z = np.exp(-(x**2 + y**2))
      >>> glyph = ArrayGlyph(z, figsize=(6, 6))
      >>> fig, ax = glyph.plot(
      ...     kind="contour", contour=Contour(labels=True, label_kw={"fmt": "%.2f"})
      ... )
      >>> bool(glyph.contour_labels) and all(
      ...     isinstance(t, Text) for t in glyph.contour_labels
      ... )
      True
      
      Without labels (the default) no labels are drawn and contour_labels stays None:
      >>> glyph = ArrayGlyph(z, figsize=(6, 6))
      >>> fig, ax = glyph.plot(kind="contour")
      >>> glyph.contour_labels is None
      True
      
  • Color bar customization:

    • Create an array and instantiate the Array object with custom options.
      >>> array = ArrayGlyph(arr, figsize=(6, 6), title="Customized color bar", title_size=18)
      >>> fig, ax = array.plot(
      ...     colorbar=ColorBar(
      ...         label="Discharge m3/s",
      ...         label_location="center",
      ...         length=0.7,
      ...         label_size=12,
      ...         ticks_spacing=5,
      ...         orientation="horizontal",
      ...     ),
      ...     color=ColorScaling.linear(),
      ...     cmap="coolwarm_r",
      ... )
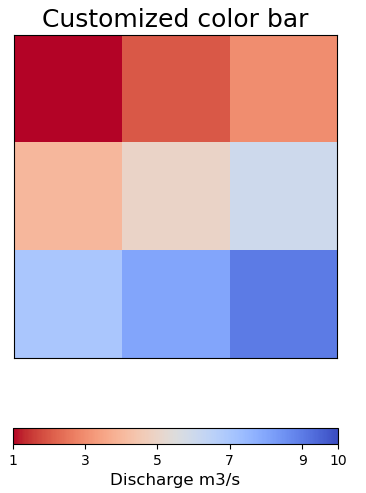
      
      color-bar-customization
  • Display values for each cell:

    • you can display the values for each cell by using thr parameter display_cell_value, and customize how the values are displayed using the parameter background_color_threshold and num_size.

      >>> array = ArrayGlyph(arr, figsize=(6, 6), title="Display array values", title_size=18)
      >>> fig, ax = array.plot(
      ...     cells=CellValues(show=True, size=12),
      ... )
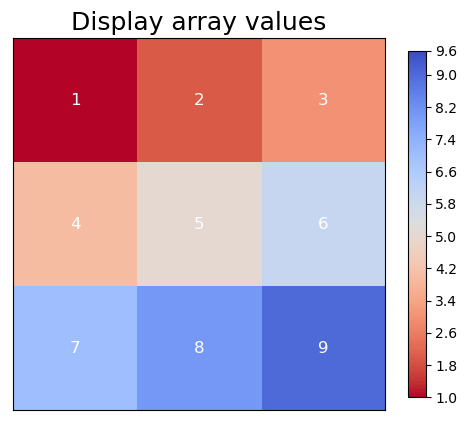
      
      display-cell-values

  • Plot points at specific locations in the array:

    • you can display points in specific cells in the array and also display a value for each of these points. The point overlay's array has the first column as the values to be displayed on top of the points, the second and third columns are the row and column index of the point in the array.
    • A PointOverlay's color/size customize the appearance of the points, while label_color/ label_size customize the appearance of each point's value label.

      >>> from cleopatra.glyphs.gridded.array_glyph import PointOverlay
      >>> array = ArrayGlyph(arr, figsize=(6, 6), title="Display Points", title_size=14)
      >>> points = np.array([[1, 0, 0], [2, 1, 1], [3, 2, 2]])
      >>> overlay = PointOverlay(
      ...     points,
      ...     color="black",
      ...     size=100,
      ...     label_color="orange",
      ...     label_size=30,
      ... )
      >>> fig, ax = array.plot(points=overlay)
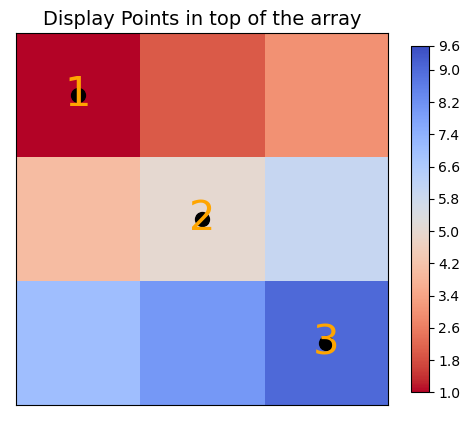
      
      display-points

  • Color scale customization:

    • Power scale (with different gamma values).

      • The default power scale uses a gamma value of 0.5.

        >>> array = ArrayGlyph(arr, figsize=(6, 6), title="Power scale", title_size=18)
        >>> fig, ax = array.plot(
        ...     colorbar=ColorBar(label="Discharge m3/s"),
        ...     color=ColorScaling.power(),
        ...     cmap="coolwarm_r",
        ... )
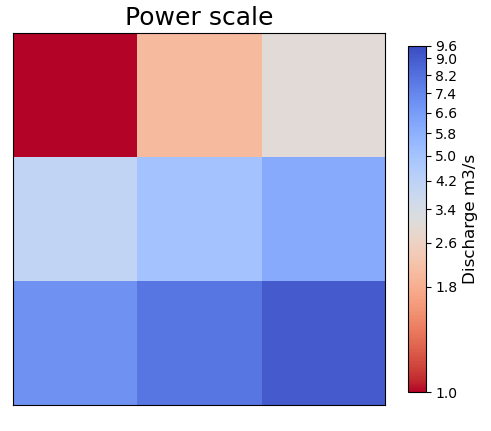
        
        power-scale

      • change the gamma of 0.8 (emphasizes higher values less).

        >>> array = ArrayGlyph(arr, figsize=(6, 6), title="Power scale - gamma=0.8", title_size=18)
        >>> fig, ax = array.plot(
        ...     color=ColorScaling.power(gamma=0.8),
        ...     cmap="coolwarm_r",
        ...     colorbar=ColorBar(label="Discharge m3/s"),
        ... )
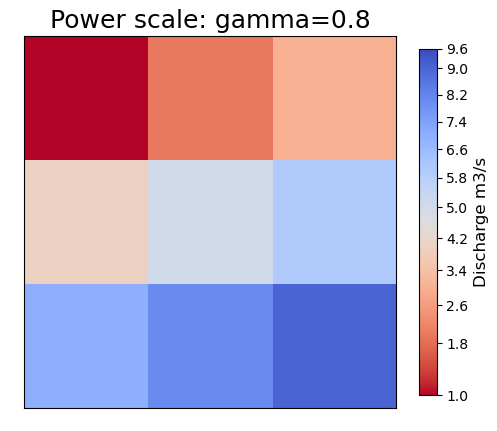
        
        power-scale-gamma-0.8

      • change the gamma of 0.1 (emphasizes higher values more).

        >>> array = ArrayGlyph(arr, figsize=(6, 6), title="Power scale - gamma=0.1", title_size=18)
        >>> fig, ax = array.plot(
        ...     color=ColorScaling.power(gamma=0.1),
        ...     cmap="coolwarm_r",
        ...     colorbar=ColorBar(label="Discharge m3/s"),
        ... )
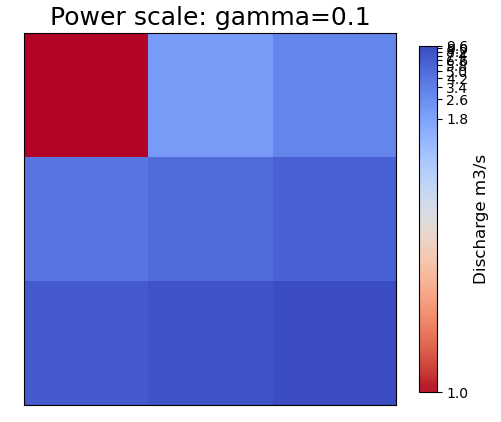
        
        power-scale-gamma-0.1

    • Logarithmic scale.

      • the symmetric-log scale takes two parameters, line_threshold and line_scale. Leaving line_threshold unset (its default) auto-derives it from the data range so the colour bar's decades track the data's own scale; line_scale defaults to 0.001.

        >>> array = ArrayGlyph(arr, figsize=(6, 6), title="Logarithmic scale", title_size=18)
        >>> fig, ax = array.plot(
        ...     colorbar=ColorBar(label="Discharge m3/s"),
        ...     color=ColorScaling.sym_log(),
        ...     cmap="coolwarm_r",
        ... )
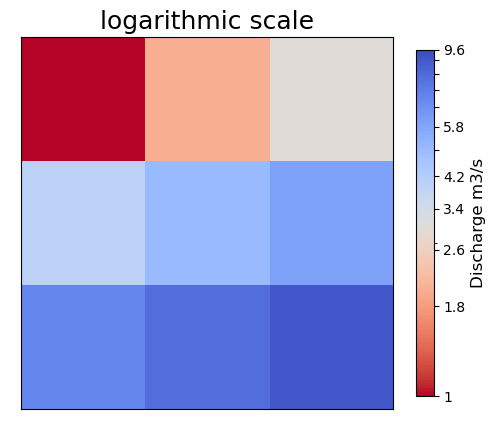
        
        log-scale

      • you can change the line_threshold and line_scale values.

        >>> array = ArrayGlyph(
        ...     arr, figsize=(6, 6), title="Logarithmic scale: Customized Parameter", title_size=12
        ... )
        >>> fig, ax = array.plot(
        ...     colorbar=ColorBar(label="Discharge m3/s"),
        ...     color=ColorScaling.sym_log(threshold=0.015, scale=0.1),
        ...     cmap="coolwarm_r",
        ... )
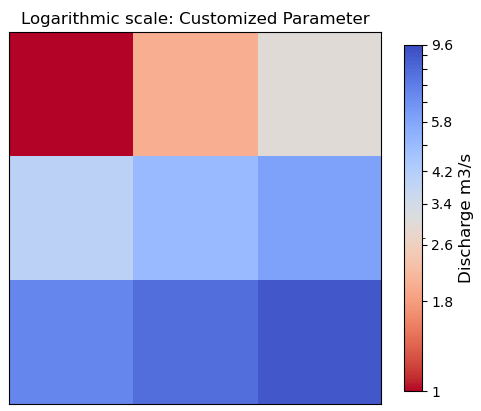
        
        log-scale

    • Defined boundary scale.

      >>> array = ArrayGlyph(arr, figsize=(6, 6), title="Defined boundary scale", title_size=18)
      >>> fig, ax = array.plot(
      ...     colorbar=ColorBar(label="Discharge m3/s"),
      ...     color=ColorScaling.boundary(),
      ...     cmap="coolwarm_r",
      ... )
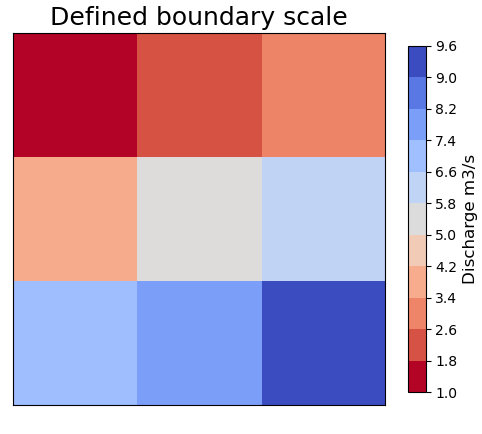
      
      boundary-scale

      • You can also define the boundaries.
        >>> array = ArrayGlyph(
        ...     arr, figsize=(6, 6), title="Defined boundary scale: defined bounds", title_size=18
        ... )
        >>> bounds = [0, 5, 10]
        >>> fig, ax = array.plot(
        ...     colorbar=ColorBar(label="Discharge m3/s"),
        ...     color=ColorScaling.boundary(bounds=bounds),
        ...     cmap="coolwarm_r",
        ... )
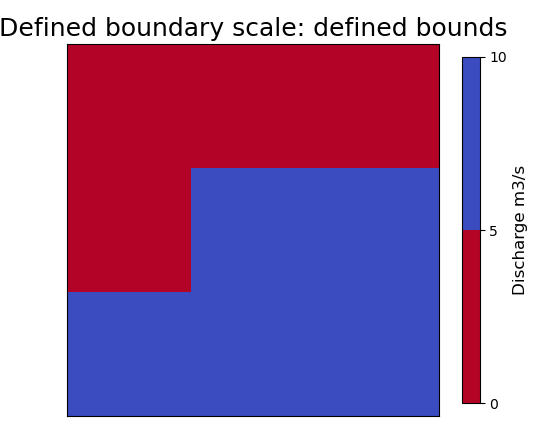
        
        boundary-scale-defined-bounds
    • Midpoint scale.

      in the midpoint scale you can define a value that splits the scale into half.

      >>> array = ArrayGlyph(arr, figsize=(6, 6), title="Midpoint scale", title_size=18)
      >>> fig, ax = array.plot(
      ...     colorbar=ColorBar(label="Discharge m3/s"),
      ...     color=ColorScaling.midpoint(at=2),
      ...     cmap="coolwarm_r",
      ... )
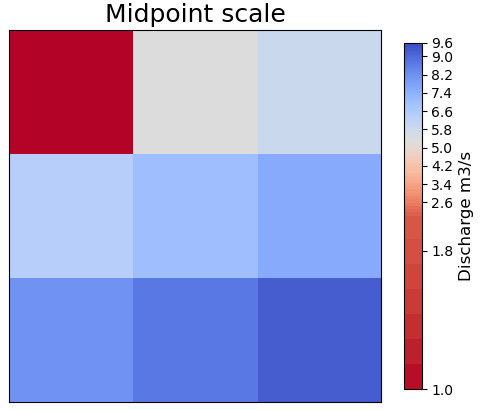
      
      midpoint-scale-costom-parameters

  • Render kinds (kind=):

    • "pcolormesh" for a quadrilateral mesh render. Note that pcolormesh does not honour extent, so the axes are drawn in array index space.
      >>> import numpy as np
      >>> from cleopatra.glyphs.gridded.array_glyph import ArrayGlyph
      >>> arr = np.arange(25, dtype=float).reshape(5, 5)
      >>> glyph = ArrayGlyph(arr)
      >>> fig, ax = glyph.plot(kind="pcolormesh")  # doctest: +SKIP
      
    • "contourf" for filled contours. When levels is set the level edges line up with the colorbar boundaries.
      >>> import numpy as np
      >>> from cleopatra.glyphs.gridded.array_glyph import ArrayGlyph
      >>> arr = np.arange(25, dtype=float).reshape(5, 5)
      >>> glyph = ArrayGlyph(arr)
      >>> fig, ax = glyph.plot(
      ...     kind="contourf", contour=Contour(levels=5)
      ... )  # doctest: +SKIP
      
    • Invalid kinds are rejected with a clear error:
      >>> import numpy as np
      >>> from cleopatra.glyphs.gridded.array_glyph import ArrayGlyph
      >>> arr = np.arange(9, dtype=float).reshape(3, 3)
      >>> ArrayGlyph(arr).plot(kind="heatmap")
      Traceback (most recent call last):
          ...
      ValueError: Invalid kind='heatmap'. Valid kinds are ('auto', 'imshow', 'pcolormesh', 'contour', 'contourf').
      
  • xarray-aligned colour kwargs:

    • robust=True clips vmin / vmax to the 2nd/98th percentile so a single outlier no longer dominates the colour scale:
      >>> import numpy as np
      >>> from cleopatra.glyphs.gridded.array_glyph import ArrayGlyph
      >>> data = np.arange(100, dtype=float).reshape(10, 10)
      >>> data[0, 0] = 1e6  # outlier
      >>> glyph = ArrayGlyph(data, robust=True)
      >>> fig, ax = glyph.plot(robust=True)  # doctest: +SKIP
      >>> round(glyph.vmin, 1), round(glyph.vmax, 1)
      (3.0, 98.0)
      
    • center=0 symmetrises the limits around zero and auto-switches the cmap to "RdBu_r" (xarray-style diverging default):
      >>> import numpy as np
      >>> from cleopatra.glyphs.gridded.array_glyph import ArrayGlyph
      >>> anomaly = np.linspace(-3.0, 8.0, 25).reshape(5, 5)
      >>> glyph = ArrayGlyph(anomaly, center=0.0)
      >>> fig, ax = glyph.plot(center=0.0)  # doctest: +SKIP
      >>> glyph.vmin, glyph.vmax
      (-8.0, 8.0)
      >>> glyph.default_options["cmap"]
      'RdBu_r'
      
    • levels discretises the colour scale and extend controls the colorbar arrows:
      >>> import numpy as np
      >>> from cleopatra.glyphs.gridded.array_glyph import ArrayGlyph
      >>> arr = np.arange(25, dtype=float).reshape(5, 5)
      >>> glyph = ArrayGlyph(arr, extend="both")
      >>> fig, ax = glyph.plot(contour=Contour(levels=6))  # doctest: +SKIP
      >>> glyph.default_options["extend"]
      'both'
      
    • cbar_kwargs forwards extra keyword arguments to the underlying matplotlib.pyplot.colorbar call; user keys win on collision:
      >>> import numpy as np
      >>> from cleopatra.glyphs.gridded.array_glyph import ArrayGlyph
      >>> arr = np.arange(9, dtype=float).reshape(3, 3)
      >>> glyph = ArrayGlyph(arr, cbar_kwargs={"shrink": 0.5})
      >>> fig, ax = glyph.plot()  # doctest: +SKIP
      >>> glyph.default_options["cbar_kwargs"]
      {'shrink': 0.5}
      
Source code in src/cleopatra/glyphs/gridded/array_glyph.py
3506
3507
3508
3509
3510
3511
3512
3513
3514
3515
3516
3517
3518
3519
3520
3521
3522
3523
3524
3525
3526
3527
3528
3529
3530
3531
3532
3533
3534
3535
3536
3537
3538
3539
3540
3541
3542
3543
3544
3545
3546
3547
3548
3549
3550
3551
3552
3553
3554
3555
3556
3557
3558
3559
3560
3561
3562
3563
3564
3565
3566
3567
3568
3569
3570
3571
3572
3573
3574
3575
3576
3577
3578
3579
3580
3581
3582
3583
3584
3585
3586
3587
3588
3589
3590
3591
3592
3593
3594
3595
3596
3597
3598
3599
3600
3601
3602
3603
3604
3605
3606
3607
3608
3609
3610
3611
3612
3613
3614
3615
3616
3617
3618
3619
3620
3621
3622
3623
3624
3625
3626
3627
3628
3629
3630
3631
3632
3633
3634
3635
3636
3637
3638
3639
3640
3641
3642
3643
3644
3645
3646
3647
3648
3649
3650
3651
3652
3653
3654
3655
3656
3657
3658
3659
3660
3661
3662
3663
3664
3665
3666
3667
3668
3669
3670
3671
3672
3673
3674
3675
3676
3677
3678
3679
3680
3681
3682
3683
3684
3685
3686
3687
3688
3689
3690
3691
3692
3693
3694
3695
3696
3697
3698
3699
3700
3701
3702
3703
3704
3705
3706
3707
3708
3709
3710
3711
3712
3713
3714
3715
3716
3717
3718
3719
3720
3721
3722
3723
3724
3725
3726
3727
3728
3729
3730
3731
3732
3733
3734
3735
3736
3737
3738
3739
3740
3741
3742
3743
3744
3745
3746
3747
3748
3749
3750
3751
3752
3753
3754
3755
3756
3757
3758
3759
3760
3761
3762
3763
3764
3765
3766
3767
3768
3769
3770
3771
3772
3773
3774
3775
3776
3777
3778
3779
3780
3781
3782
3783
3784
3785
3786
3787
3788
3789
3790
3791
3792
3793
3794
3795
3796
3797
3798
3799
3800
3801
3802
3803
3804
3805
3806
3807
3808
3809
3810
3811
3812
3813
3814
3815
3816
3817
3818
3819
3820
3821
3822
3823
3824
3825
3826
3827
3828
3829
3830
3831
3832
3833
3834
3835
3836
3837
3838
3839
3840
3841
3842
3843
3844
3845
3846
3847
3848
3849
3850
3851
3852
3853
3854
3855
3856
3857
3858
3859
3860
3861
3862
3863
3864
3865
3866
3867
3868
3869
3870
3871
3872
3873
3874
3875
3876
3877
3878
3879
3880
3881
3882
3883
3884
3885
3886
3887
3888
3889
3890
3891
3892
3893
3894
3895
3896
3897
3898
3899
3900
3901
3902
3903
3904
3905
3906
3907
3908
3909
3910
3911
3912
3913
3914
3915
3916
3917
3918
3919
3920
3921
3922
3923
3924
3925
3926
3927
3928
3929
3930
3931
3932
3933
3934
3935
3936
3937
3938
3939
3940
3941
3942
3943
3944
3945
3946
3947
3948
3949
3950
3951
3952
3953
3954
3955
3956
3957
3958
3959
3960
3961
3962
3963
3964
3965
3966
3967
3968
3969
3970
3971
3972
3973
3974
3975
3976
3977
3978
3979
3980
3981
3982
3983
3984
3985
3986
3987
3988
3989
3990
3991
3992
3993
3994
3995
3996
3997
3998
3999
4000
4001
4002
4003
4004
4005
4006
4007
4008
4009
4010
4011
4012
4013
4014
4015
4016
4017
4018
4019
4020
4021
4022
4023
4024
4025
4026
4027
4028
4029
4030
4031
4032
4033
4034
4035
4036
4037
4038
4039
4040
4041
4042
4043
4044
4045
4046
4047
4048
4049
4050
4051
4052
4053
4054
4055
4056
4057
4058
4059
4060
4061
4062
4063
4064
4065
4066
4067
4068
4069
4070
4071
4072
4073
4074
4075
4076
4077
4078
4079
4080
4081
4082
4083
4084
4085
4086
4087
4088
4089
4090
4091
4092
4093
4094
4095
4096
4097
4098
4099
4100
4101
4102
4103
4104
4105
4106
4107
4108
4109
4110
4111
4112
4113
4114
4115
4116
4117
4118
4119
4120
4121
4122
4123
4124
4125
4126
4127
4128
4129
4130
4131
4132
4133
4134
4135
4136
4137
4138
4139
4140
4141
4142
4143
4144
4145
4146
4147
4148
4149
4150
4151
4152
4153
4154
4155
4156
4157
4158
4159
4160
4161
4162
4163
4164
4165
4166
4167
4168
4169
4170
4171
4172
4173
4174
4175
4176
4177
4178
4179
4180
4181
4182
4183
4184
4185
4186
4187
4188
4189
4190
4191
4192
4193
4194
4195
4196
4197
4198
4199
4200
4201
4202
4203
4204
4205
4206
4207
4208
4209
4210
4211
4212
4213
4214
4215
4216
4217
4218
4219
4220
4221
4222
4223
4224
4225
4226
4227
4228
4229
4230
4231
4232
4233
4234
4235
4236
4237
4238
4239
4240
4241
4242
4243
4244
4245
4246
4247
4248
4249
4250
4251
4252
4253
4254
4255
4256
4257
4258
4259
4260
4261
4262
4263
4264
4265
4266
4267
4268
4269
4270
4271
4272
4273
4274
4275
4276
4277
4278
4279
4280
4281
4282
4283
4284
4285
4286
4287
4288
4289
4290
4291
4292
4293
4294
4295
4296
4297
4298
4299
4300
4301
4302
4303
4304
4305
4306
4307
4308
4309
4310
4311
4312
4313
4314
4315
4316
4317
4318
4319
4320
4321
4322
4323
4324
4325
4326
4327
4328
4329
4330
4331
4332
4333
4334
4335
4336
4337
4338
4339
4340
4341
4342
4343
4344
4345
4346
4347
4348
4349
4350
4351
4352
4353
4354
4355
4356
4357
4358
4359
4360
4361
4362
4363
4364
4365
4366
4367
4368
4369
4370
4371
4372
4373
4374
4375
4376
4377
4378
4379
4380
4381
4382
4383
4384
4385
4386
4387
4388
4389
4390
4391
4392
4393
def plot(
    self,
    points: PointOverlay | None = None,
    kind: str = "auto",
    ax: Axes | None = None,
    title: str | None = None,
    color: ColorScaling | Normalize | None = None,
    contour: Contour | None = None,
    cells: CellValues | None = None,
    classify: Classify | None = None,
    data_style: DataStyle | None = None,
    full_bleed: bool | str = False,
    basemap: bool | dict | Basemap | Callable[[Any], None] | None = None,
    colorbar: bool | ColorBar | None = None,
    compose: bool = False,
    **kwargs: Unpack[PlotKwargs],
) -> tuple[Figure, Axes]:
    """Plot the array with customizable visualization options.

    This method creates a visualization of the array with various customization options
    including color scales, color bars, cell value display, and point annotations.
    It supports both regular arrays and RGB arrays.

    Args:
        points: Points to display on the array, by default None. A
            `PointOverlay` bundling the `(N, 3)` array of
            `[value, row, col]` per point together with the marker /
            value-label styling (`color` / `size` / `label_color` /
            `label_size`).
        kind: Render kind, by default `"auto"`. One of:

            - `"auto"` — picks the best renderer for the data.
              Routes to `"pcolormesh"` when curvilinear /
              non-uniform `coords` were passed to the
              constructor, otherwise falls back to `"imshow"`.
            - `"imshow"` — pixel-grid raster render via
              `ax.imshow`/`matshow`. Honours `extent`.
              Incompatible with `coords`.
            - `"pcolormesh"` — quadrilateral mesh render via
              `ax.pcolormesh` with `shading="auto"`. Honours
              `coords` (1-D centres or 2-D curvilinear).
            - `"contour"` — line contours via `ax.contour`.
              Honours `levels` from kwargs when set.
            - `"contourf"` — filled contours via `ax.contourf`.
              Honours `levels` from kwargs when set.

            Cell-value display and point overlays only apply to
            `"imshow"` and `"pcolormesh"`; they are silently
            skipped for `"contour"` and `"contourf"` (which have
            no per-cell grid). RGB compositing requires
            `kind="imshow"`.
        ax: Target axes to draw on, by default None. When given,
            the plot is composed into this axes (and its parent
            figure, via `ax.get_figure()`), mirroring the other
            glyphs' `plot(ax=...)`. Resolution priority is
            `plot(ax=)` > the axes bound at construction > an axes
            derived from a figure bound at construction > a fresh
            figure/axes. `fig` is intentionally not a parameter
            here — it is a construction-time binding derived from
            the axes.
        title: Plot title, by default None. A convenience shortcut
            equivalent to the `title` option; when given it
            overrides the `title` set at construction.
        color: Colour-scale group object
            (`cleopatra.styling.scaling.ColorScaling`) selecting the
            norm and its knobs, e.g. `ColorScaling.power(gamma=0.7)` or
            `ColorScaling.boundary(bounds=[...])`. Replaces the former
            loose `color_scale` / `gamma` / `line_threshold` /
            `line_scale` / `bounds` / `midpoint` keywords.
        contour: Contour/discretisation group object
            (`cleopatra.styling.params.Contour`), e.g.
            `Contour(levels=5)` or `Contour(labels=True,
            label_kw={"fmt": "%.2f"})`. Replaces the loose `levels` /
            `labels` / `label_kw` keywords.
        cells: Per-cell value-text group object
            (`cleopatra.styling.params.CellValues`), e.g.
            `CellValues(show=True, size=8)`. Replaces the loose
            `display_cell_value` / `num_size` /
            `background_color_threshold` keywords.
        classify: Value-classification group object
            (`cleopatra.styling.params.Classify`), by default `None`
            (a continuous colour scale). Bins the array's finite cells into
            discrete colour classes drawn with a stepped colorbar, e.g.
            `Classify(scheme="quantiles", k=5)`,
            `Classify(scheme="natural_breaks", k=7)`, or explicit edges
            `Classify(scheme=[0, 10, 50, 100, 500])`. The scheme owns the
            norm, so `color`'s `color_scale` / `levels` are ignored when it
            is set (a warning says so), and the classes are derived from the
            data itself -- a caller `vmin` / `vmax` does not constrain them
            (pass explicit edges to pin the class boundaries instead).
            `scheme="categorical"` is rejected for a raster (its cells are a
            continuous field), so a `Classify.category_legend_kwargs` is
            accepted but has no effect here. A `data_style` preset owns the
            colour mapping outright, so `classify` is ignored when `style` is
            set (a warning says so).
        data_style: Named-preset / relief-shading group object
            (`cleopatra.styling.params.DataStyle`), e.g.
            `DataStyle(style="dem", hillshade=True)` or
            `DataStyle(style="temperature_2m", bands=6, alpha=0.5)`.
            Replaces the loose `style` / `hillshade` keywords and the
            per-call preset overrides `bands` / `alpha` / `alpha_range`.
        full_bleed: Fill the whole figure edge-to-edge with no surrounding
            margin, by default False. `True` hides ticks and spines and
            resizes the figure to the data box's aspect so the fill has no
            distortion, leaving the canvas colour untouched (masked / no-data
            cells keep the default background). Pass a colour string instead
            (e.g. `"black"`) to also paint the canvas that colour -- e.g. so
            a semi-transparent relief reads dark. Same flag as
            `animate(full_bleed=...)`. Intended for chrome-free maps -- a
            colorbar or title has no room, so pair it with
            `add_colorbar=False` and omit the title (an outside colorbar is
            otherwise left floating over the filled axes); a scale swatch
            (from `style`) still fits inside. It resizes the whole figure and
            gives its axes the entire canvas, so use a dedicated figure --
            passing `ax=` one subplot of several lets `full_bleed` take over
            the figure and hide the siblings.
        basemap: A reference backdrop drawn via the glyph's own
            `add_relief` / `add_features`, composed by `zorder` (relief
            under the data, coastline/borders over it), by default None (no
            basemap). Accepts ``True`` for a sensible default (a `"low"`
            relief plus grey `"50m"` coastline and borders), a `Basemap`
            (the typed, validated form -- `relief` / `features` /
            `resolution` / `check_alignment`, with `features` taking
            `Feature` objects), a **dict** with the same keys (see
            `GeoMixin._draw_basemap`), or a **callable** ``f(glyph)`` for
            full control. Same flag as `animate(basemap=...)`. On a
            projected axis, set `self.crs` first so the relief is warped to
            match the data. Drawing the relief needs the `[tiles]` extra
            (Pillow, and pyproj for a non-4326 `crs`).
        compose: Draw *over* whatever is already on `ax` instead of
            replacing it, leaving another glyph's layers, colorbar and ticks
            intact, along with the host's title unless this glyph carries
            one of its own -- and, on a `style=` preset, the host's canvas
            colour and projection frame too. Off by default, where a render
            replaces every glyph's artists on the axes (see issue #210).
            Turn it on to lay one field over another. An overlay also draws
            **no colorbar of its own** by default: `fig.colorbar()` takes
            its space from the host axes, so a stack of overlays would
            re-lay-out the host once per layer. Pass `colorbar=` or
            `add_colorbar=True` (at construction or on the call) to get one
            anyway.
        colorbar: Colorbar presence and placement. `None` (default) keeps
            matplotlib's placement (honouring the legacy `add_colorbar`);
            `False` draws no colorbar; `True` a default one. Under
            `compose=True`, passing anything but `None` here also counts as
            asking for the overlay's own colorbar, which is otherwise off.
            Pass a `ColorBar` for control -- an edge (`location`), an
            `inside` inset that tracks `full_bleed`, a backing `box`
            (defaulted on for an inset), and text colours (`label_color` for
            the title, `tick_color` for the tick numbers). Same flag as
            `animate(colorbar=)`.
            On a `style=` preset, a placement `ColorBar` (or `True`) overrides
            the swatch with a real colorbar; a colours-only `ColorBar` styles
            the swatch in place (defaults < preset < explicit).
        **kwargs: Additional keyword arguments for customizing the plot.

            Plot appearance:
                title : str, optional
                    Title of the plot, by default 'Array Plot'.
                title_size : int, optional
                    Title font size, by default 15.
                cmap : str or matplotlib.colors.Colormap, optional
                    Colormap, by default 'coolwarm_r'. A plain matplotlib
                    name (e.g. 'viridis') or a `Colormap` object is used
                    as-is; a **namespaced** name such as 'cmocean:thermal'
                    or 'cmasher:ember' is resolved via the optional `cmap`
                    aggregator — install the `[science-colors]` extra
                    (`pip install cleopatra[science-colors]`). The `_r`
                    reverse suffix works on both forms.
                vmin : float, optional
                    Minimum value for color scaling, by default min(array).
                vmax : float, optional
                    Maximum value for color scaling, by default max(array).

            Color bar options:
                add_colorbar : bool, optional
                    Whether to draw the glyph's own color bar, by
                    default True -- except under `compose=True`, which
                    defaults it off so an overlay does not take space
                    from the host axes; passing it there (`True` or
                    `False`) still decides the matter. With it off
                    `self.cbar` stays None, no axes space is taken by a
                    color bar, and the mappable is still reachable via
                    `self.im`.
                    Note: for a constant-value field rendered as line
                    `contour` there are no contour lines to map, so the
                    color bar is skipped (with a warning) even when
                    `add_colorbar` is True, and `self.cbar` stays None.
                cbar_orientation : str, optional
                    Prefer `colorbar=ColorBar(orientation=...)`.
                    Orientation of the color bar, by default 'vertical'.
                    Can be 'horizontal' or 'vertical'.
                cbar_label_rotation : float, optional
                    Prefer `colorbar=ColorBar(label_rotation=...)`.
                    Rotation angle (degrees) of the color bar label, by
                    default None (matplotlib's own label orientation).
                cbar_label_location : str, optional
                    Prefer `colorbar=ColorBar(label_location=...)`.
                    Location of the color bar label, by default 'center'.
                    Valid values depend on the bar orientation -- vertical:
                    'top'/'center'/'bottom'; horizontal: 'left'/'center'/'right'.
                cbar_length : float, optional
                    Prefer `colorbar=ColorBar(length=...)`. Ratio to
                    control the height/width of the color bar, by default 0.75.
                ticks_spacing : int, optional
                    Prefer `colorbar=ColorBar(ticks_spacing=...)`.
                    Spacing between ticks on the color bar, by default 5.
                cbar_label_size : int, optional
                    Prefer `colorbar=ColorBar(label_size=...)`. Font
                    size of the color bar label, by default 12.
                cbar_label : str, optional
                    Prefer `colorbar=ColorBar(label=...)`. Label text
                    for the color bar, by default None.

            Colour scale (moved to the `color=` object):
                The colour-scale options (`color_scale`, `gamma`,
                `line_threshold`, `line_scale`, `bounds`, `midpoint`)
                and the discretisation `levels` are now set through the
                `color=` / `contour=` parameters -- see
                `cleopatra.styling.scaling.ColorScaling` and
                `cleopatra.styling.params.Contour`. Passing them as
                loose keywords raises with a pointer to the object.

            Xarray-aligned colour kwargs:
                robust : bool, optional
                    When True, use the 2nd and 98th percentile of
                    the unmasked data for `vmin` / `vmax`,
                    matching xarray's `robust=True` default. An
                    explicit `vmin` / `vmax` always wins. By
                    default False.
                center : float, optional
                    Diverging-colormap centring value. When set,
                    `vmin` / `vmax` are made symmetric around
                    `center` (after `robust` has been applied),
                    and the cmap auto-switches to `"RdBu_r"` if
                    the caller did not pass an explicit `cmap`.
                    By default None (no centring).
                extend : str, optional
                    Colorbar arrow extension. One of `"neither"`,
                    `"both"`, `"min"`, `"max"`, or None to
                    auto-resolve (`"both"` when `levels` is
                    set, otherwise `"neither"`). By default
                    None.
                cbar_kwargs : dict, optional
                    Extra keyword arguments forwarded to
                    `fig.colorbar`. Merges over the defaults
                    computed by cleopatra so user keys win on
                    collision. Common keys: `label`, `shrink`,
                    `aspect`, `orientation`, `pad`,
                    `ticks`. By default None.

            Contour / cell-value / data-style (moved to group objects):
                Contour labels (`labels`, `label_kw`) move to
                `contour=Contour(...)`; per-cell value text
                (`display_cell_value`, `num_size`,
                `background_color_threshold`) moves to
                `cells=CellValues(...)`; the named preset, relief
                shading, and the per-call preset overrides (`style`,
                `hillshade`, `bands`, `alpha`, `alpha_range`) move to
                `data_style=DataStyle(...)`. See
                `cleopatra.styling.params`. Passing any of them as a
                loose keyword raises with a pointer to the object. A
                continuous `data_style` preset still composes with its
                `hillshade`; a categorical preset presents a discrete
                legend and is not shaded.

            Other kwargs:
                projection : str, optional
                    Draw the field on a projection preset: `"globe"`
                    (orthographic) or `"flat"`. Requires 1-D lon/lat
                    `coords=(lon, lat)`; the field is reprojected and, for
                    `"globe"`, the boundary + graticule are drawn. `"globe"`
                    needs `pyproj` (the `[tiles]` extra). By default None
                    (unprojected raster).

    Returns:
        tuple[matplotlib.figure.Figure, matplotlib.axes.Axes]: A tuple containing:
            - fig: The matplotlib Figure object
            - ax: The matplotlib Axes object

        The colour-mapped artist (the `ScalarMappable` — e.g. the
        `AxesImage` for `imshow`, the `QuadMesh` for
        `pcolormesh`, the `QuadContourSet` for
        `contour`/`contourf`, or the RGB `AxesImage`) is also
        stored on the instance as `self.im` after this call, so a
        caller can attach a colorbar/legend or query the colour
        limits without scraping `ax.images`/`ax.collections`.

    Raises:
        ValueError: If an invalid keyword argument is provided.

    Notes:
        This method does not call `plt.show()`; it returns the Figure and Axes so
        the caller can compose, save, or display them. In an interactive session call
        `plt.show()` yourself (or `fig.savefig(...)` to write the plot to disk)
        after `plot()` returns.

    Examples:
    - Basic array plot:

        ```python
        >>> import numpy as np
        >>> from cleopatra.glyphs.gridded.array_glyph import ArrayGlyph
        >>> arr = np.array([[1, 2, 3], [4, 5, 6], [7, 8, 9]])
        >>> array = ArrayGlyph(arr, figsize=(6, 6), title="Customized Plot", title_size=18)
        >>> fig, ax = array.plot()

        ```
    ![array-plot](./../images/array_glyph/array-plot.png)

    - Labelled line contours (`kind="contour"`, `labels=True`):

        - inline numeric labels are drawn on the isolines and the
            label `Text` artists are kept on `glyph.contour_labels`:
            ```python
            >>> from matplotlib.text import Text
            >>> y, x = np.mgrid[-3:3:30j, -3:3:30j]
            >>> z = np.exp(-(x**2 + y**2))
            >>> glyph = ArrayGlyph(z, figsize=(6, 6))
            >>> fig, ax = glyph.plot(
            ...     kind="contour", contour=Contour(labels=True, label_kw={"fmt": "%.2f"})
            ... )
            >>> bool(glyph.contour_labels) and all(
            ...     isinstance(t, Text) for t in glyph.contour_labels
            ... )
            True

            ```
            Without `labels` (the default) no labels are drawn and
            `contour_labels` stays `None`:
            ```python
            >>> glyph = ArrayGlyph(z, figsize=(6, 6))
            >>> fig, ax = glyph.plot(kind="contour")
            >>> glyph.contour_labels is None
            True

            ```

    - Color bar customization:

        - Create an array and instantiate the `Array` object with custom options.
            ```python
            >>> array = ArrayGlyph(arr, figsize=(6, 6), title="Customized color bar", title_size=18)
            >>> fig, ax = array.plot(
            ...     colorbar=ColorBar(
            ...         label="Discharge m3/s",
            ...         label_location="center",
            ...         length=0.7,
            ...         label_size=12,
            ...         ticks_spacing=5,
            ...         orientation="horizontal",
            ...     ),
            ...     color=ColorScaling.linear(),
            ...     cmap="coolwarm_r",
            ... )

            ```
            ![color-bar-customization](./../images/array_glyph/color-bar-customization.png)

    - Display values for each cell:

        - you can display the values for each cell by using thr parameter `display_cell_value`, and customize how
            the values are displayed using the parameter `background_color_threshold` and `num_size`.

            ```python
            >>> array = ArrayGlyph(arr, figsize=(6, 6), title="Display array values", title_size=18)
            >>> fig, ax = array.plot(
            ...     cells=CellValues(show=True, size=12),
            ... )

            ```
            ![display-cell-values](./../images/array_glyph/display-cell-values.png)

    - Plot points at specific locations in the array:

        - you can display points in specific cells in the array and also display a value for each of these points.
            The point overlay's array has the first column as the values to be displayed on top of the
            points, the second and third columns are the row and column index of the point in the array.
        - A `PointOverlay`'s `color`/`size` customize the appearance of the points, while `label_color`/
            `label_size` customize the appearance of each point's value label.

            ```python
            >>> from cleopatra.glyphs.gridded.array_glyph import PointOverlay
            >>> array = ArrayGlyph(arr, figsize=(6, 6), title="Display Points", title_size=14)
            >>> points = np.array([[1, 0, 0], [2, 1, 1], [3, 2, 2]])
            >>> overlay = PointOverlay(
            ...     points,
            ...     color="black",
            ...     size=100,
            ...     label_color="orange",
            ...     label_size=30,
            ... )
            >>> fig, ax = array.plot(points=overlay)

            ```
            ![display-points](./../images/array_glyph/display-points.png)

    - Color scale customization:

        - Power scale (with different gamma values).

            - The default power scale uses a gamma value of 0.5.

                ```python
                >>> array = ArrayGlyph(arr, figsize=(6, 6), title="Power scale", title_size=18)
                >>> fig, ax = array.plot(
                ...     colorbar=ColorBar(label="Discharge m3/s"),
                ...     color=ColorScaling.power(),
                ...     cmap="coolwarm_r",
                ... )

                ```
                ![power-scale](./../images/array_glyph/power-scale.png)

            - change the gamma of 0.8 (emphasizes higher values less).

                ```python
                >>> array = ArrayGlyph(arr, figsize=(6, 6), title="Power scale - gamma=0.8", title_size=18)
                >>> fig, ax = array.plot(
                ...     color=ColorScaling.power(gamma=0.8),
                ...     cmap="coolwarm_r",
                ...     colorbar=ColorBar(label="Discharge m3/s"),
                ... )

                ```
                ![power-scale-gamma-0.8](./../images/array_glyph/power-scale-gamma-0.8.png)

            - change the gamma of 0.1 (emphasizes higher values more).

                ```python
                >>> array = ArrayGlyph(arr, figsize=(6, 6), title="Power scale - gamma=0.1", title_size=18)
                >>> fig, ax = array.plot(
                ...     color=ColorScaling.power(gamma=0.1),
                ...     cmap="coolwarm_r",
                ...     colorbar=ColorBar(label="Discharge m3/s"),
                ... )

                ```
                ![power-scale-gamma-0.1](./../images/array_glyph/power-scale-gamma-0.1.png)

        - Logarithmic scale.

            - the symmetric-log scale takes two parameters, `line_threshold` and `line_scale`. Leaving
            `line_threshold` unset (its default) auto-derives it from the data range so the colour bar's
            decades track the data's own scale; `line_scale` defaults to 0.001.
                ```python
                >>> array = ArrayGlyph(arr, figsize=(6, 6), title="Logarithmic scale", title_size=18)
                >>> fig, ax = array.plot(
                ...     colorbar=ColorBar(label="Discharge m3/s"),
                ...     color=ColorScaling.sym_log(),
                ...     cmap="coolwarm_r",
                ... )

                ```
                ![log-scale](./../images/array_glyph/log-scale.png)

            - you can change the `line_threshold` and `line_scale` values.
                ```python
                >>> array = ArrayGlyph(
                ...     arr, figsize=(6, 6), title="Logarithmic scale: Customized Parameter", title_size=12
                ... )
                >>> fig, ax = array.plot(
                ...     colorbar=ColorBar(label="Discharge m3/s"),
                ...     color=ColorScaling.sym_log(threshold=0.015, scale=0.1),
                ...     cmap="coolwarm_r",
                ... )

                ```
                ![log-scale](./../images/array_glyph/log-scale-custom-parameters.png)

        - Defined boundary scale.
            ```python
            >>> array = ArrayGlyph(arr, figsize=(6, 6), title="Defined boundary scale", title_size=18)
            >>> fig, ax = array.plot(
            ...     colorbar=ColorBar(label="Discharge m3/s"),
            ...     color=ColorScaling.boundary(),
            ...     cmap="coolwarm_r",
            ... )

            ```
            ![boundary-scale](./../images/array_glyph/boundary-scale.png)

            - You can also define the boundaries.
                ```python
                >>> array = ArrayGlyph(
                ...     arr, figsize=(6, 6), title="Defined boundary scale: defined bounds", title_size=18
                ... )
                >>> bounds = [0, 5, 10]
                >>> fig, ax = array.plot(
                ...     colorbar=ColorBar(label="Discharge m3/s"),
                ...     color=ColorScaling.boundary(bounds=bounds),
                ...     cmap="coolwarm_r",
                ... )

                ```
                ![boundary-scale-defined-bounds](./../images/array_glyph/boundary-scale-defined-bounds.png)

        - Midpoint scale.

            in the midpoint scale you can define a value that splits the scale into half.
            ```python
            >>> array = ArrayGlyph(arr, figsize=(6, 6), title="Midpoint scale", title_size=18)
            >>> fig, ax = array.plot(
            ...     colorbar=ColorBar(label="Discharge m3/s"),
            ...     color=ColorScaling.midpoint(at=2),
            ...     cmap="coolwarm_r",
            ... )

            ```
            ![midpoint-scale-costom-parameters](./../images/array_glyph/midpoint-scale-costom-parameters.png)

    - Render kinds (`kind=`):

        - `"pcolormesh"` for a quadrilateral mesh render. Note
            that `pcolormesh` does not honour `extent`, so the
            axes are drawn in array index space.
            ```python
            >>> import numpy as np
            >>> from cleopatra.glyphs.gridded.array_glyph import ArrayGlyph
            >>> arr = np.arange(25, dtype=float).reshape(5, 5)
            >>> glyph = ArrayGlyph(arr)
            >>> fig, ax = glyph.plot(kind="pcolormesh")  # doctest: +SKIP

            ```
        - `"contourf"` for filled contours. When `levels` is set
            the level edges line up with the colorbar boundaries.
            ```python
            >>> import numpy as np
            >>> from cleopatra.glyphs.gridded.array_glyph import ArrayGlyph
            >>> arr = np.arange(25, dtype=float).reshape(5, 5)
            >>> glyph = ArrayGlyph(arr)
            >>> fig, ax = glyph.plot(
            ...     kind="contourf", contour=Contour(levels=5)
            ... )  # doctest: +SKIP

            ```
        - Invalid kinds are rejected with a clear error:
            ```python
            >>> import numpy as np
            >>> from cleopatra.glyphs.gridded.array_glyph import ArrayGlyph
            >>> arr = np.arange(9, dtype=float).reshape(3, 3)
            >>> ArrayGlyph(arr).plot(kind="heatmap")
            Traceback (most recent call last):
                ...
            ValueError: Invalid kind='heatmap'. Valid kinds are ('auto', 'imshow', 'pcolormesh', 'contour', 'contourf').

            ```

    - xarray-aligned colour kwargs:

        - `robust=True` clips `vmin` / `vmax` to the
            2nd/98th percentile so a single outlier no longer
            dominates the colour scale:
            ```python
            >>> import numpy as np
            >>> from cleopatra.glyphs.gridded.array_glyph import ArrayGlyph
            >>> data = np.arange(100, dtype=float).reshape(10, 10)
            >>> data[0, 0] = 1e6  # outlier
            >>> glyph = ArrayGlyph(data, robust=True)
            >>> fig, ax = glyph.plot(robust=True)  # doctest: +SKIP
            >>> round(glyph.vmin, 1), round(glyph.vmax, 1)
            (3.0, 98.0)

            ```
        - `center=0` symmetrises the limits around zero and
            auto-switches the cmap to `"RdBu_r"` (xarray-style
            diverging default):
            ```python
            >>> import numpy as np
            >>> from cleopatra.glyphs.gridded.array_glyph import ArrayGlyph
            >>> anomaly = np.linspace(-3.0, 8.0, 25).reshape(5, 5)
            >>> glyph = ArrayGlyph(anomaly, center=0.0)
            >>> fig, ax = glyph.plot(center=0.0)  # doctest: +SKIP
            >>> glyph.vmin, glyph.vmax
            (-8.0, 8.0)
            >>> glyph.default_options["cmap"]
            'RdBu_r'

            ```
        - `levels` discretises the colour scale and `extend`
            controls the colorbar arrows:
            ```python
            >>> import numpy as np
            >>> from cleopatra.glyphs.gridded.array_glyph import ArrayGlyph
            >>> arr = np.arange(25, dtype=float).reshape(5, 5)
            >>> glyph = ArrayGlyph(arr, extend="both")
            >>> fig, ax = glyph.plot(contour=Contour(levels=6))  # doctest: +SKIP
            >>> glyph.default_options["extend"]
            'both'

            ```
        - `cbar_kwargs` forwards extra keyword arguments to the
            underlying `matplotlib.pyplot.colorbar` call;
            user keys win on collision:
            ```python
            >>> import numpy as np
            >>> from cleopatra.glyphs.gridded.array_glyph import ArrayGlyph
            >>> arr = np.arange(9, dtype=float).reshape(3, 3)
            >>> glyph = ArrayGlyph(arr, cbar_kwargs={"shrink": 0.5})
            >>> fig, ax = glyph.plot()  # doctest: +SKIP
            >>> glyph.default_options["cbar_kwargs"]
            {'shrink': 0.5}

            ```
    """
    if kind not in VALID_PLOT_KINDS:
        raise ValueError(
            f"Invalid kind={kind!r}. Valid kinds are {VALID_PLOT_KINDS}."
        )
    if self.rgb and kind not in ("imshow", "auto"):
        raise ValueError(
            f"RGB compositing requires kind='imshow'. Got kind={kind!r}."
        )

    # Snapshot the pre-merge value of every option key these group objects
    # will touch, so an invalid `style` (validated below) can roll back the
    # WHOLE merge -- not just `style` -- and a co-passed color=/contour=/cells=
    # cannot leak into a later plain plot() on this (sticky-options) glyph.
    self._warn_norm_shadows_scale(color, kwargs.get("norm"))
    pre_group_opts = self._snapshot_group_options(
        color, contour, cells, classify, data_style
    )
    self._merge_group_params(color, contour, cells, classify, data_style)
    resolved_colorbar = self._apply_kwargs_and_colorbar(colorbar, kwargs)  # type: ignore[arg-type]

    self._validate_extend(self.default_options.get("extend"))

    self.default_options["kind"] = kind
    if kind == "auto":
        effective_kind = "pcolormesh" if self._coords is not None else "imshow"
    else:
        effective_kind = kind

    if ax is not None:
        self.ax = ax
        self.fig = _root_figure(ax)
        self._auto_figure = False
        self._owns_figure = False
    elif self.fig is None:
        self.fig, self.ax = self.create_figure_axes()
    elif self.ax is None:
        # A figure was bound without an axes: draw into the caller's figure
        # (its first axes, or a fresh one) rather than leaving self.ax None.
        self.ax = self.fig.axes[0] if self.fig.axes else self.fig.add_subplot(111)
        self._auto_figure = False
        self._owns_figure = False

    if title is not None:
        self.default_options["title"] = title

    arr = self.arr
    fig, ax = self.fig, self.ax

    style = self.default_options.get("style")
    if style is not None:
        try:
            resolve_single_layer_style(style)
        except ValueError:
            # Roll back the WHOLE merge to its pre-call snapshot -- every
            # key the group objects merged (style plus any co-passed
            # color=/contour=/cells=) -- so a failed styled plot never
            # leaks options into a later plain plot() on this glyph.
            for key, value in pre_group_opts.items():
                self.default_options[key] = value
            raise
        if self.rgb:
            warnings.warn(
                "data-style presets do not apply to RGB arrays; 'style' is "
                "ignored and the RGB image is drawn as-is.",
                stacklevel=2,
            )
        else:
            if points is not None or self.default_options.get("display_cell_value"):
                warnings.warn(
                    "data-style presets bypass point and cell-value overlays; "
                    "'points' and 'display_cell_value' are ignored with 'style'.",
                    stacklevel=2,
                )
            if self.default_options.get("scheme") is not None:
                warnings.warn(
                    "a data-style preset owns the colour mapping, so 'classify' "
                    "is ignored with 'style'; drop 'data_style' to draw the "
                    "classified field.",
                    stacklevel=2,
                )
            self._plot_with_style(style, compose=compose)
            if basemap is not None:
                self._draw_basemap(basemap)
            if full_bleed:
                self._apply_full_bleed(
                    facecolor=full_bleed if isinstance(full_bleed, str) else None
                )
            elif getattr(self, "_auto_figure", False):
                self._tighten_figure()
            return self.fig, self.ax

    if self.rgb:
        _clear_prior_render_artists(ax, self, compose=compose)
        extent = tuple(self.extent) if self.extent is not None else None
        self.im = ax.imshow(arr, extent=extent)
        self.cbar = None
    else:
        if "ticks_spacing" not in resolved_colorbar:
            if "ticks_spacing" in kwargs.keys():
                self.default_options["ticks_spacing"] = kwargs["ticks_spacing"]
            else:
                self.default_options["ticks_spacing"] = self.ticks_spacing

        recompute_keys = {"robust", "center", "vmin", "vmax"}
        if recompute_keys.intersection(kwargs.keys()):
            vmin_final, vmax_final = self._resolve_color_limits(
                arr,
                vmin_kw=kwargs.get("vmin"),
                vmax_kw=kwargs.get("vmax"),
                robust=bool(self.default_options.get("robust", False)),
                center=self.default_options.get("center"),
                vmin_explicit="vmin" in kwargs,
                vmax_explicit="vmax" in kwargs,
            )
            self._vmin = vmin_final
            self._vmax = vmax_final
            if (
                "ticks_spacing" not in kwargs
                and "ticks_spacing" not in resolved_colorbar
            ):
                self.ticks_spacing = (vmax_final - vmin_final) / 10 or 1.0
                self.default_options["ticks_spacing"] = self.ticks_spacing

        if (
            "center" in kwargs
            and kwargs["center"] is not None
            and "cmap" not in kwargs
        ):
            self.default_options["cmap"] = DIVERGING_DEFAULT_CMAP

        self._vmin_explicit = self._vmin_explicit or "vmin" in kwargs
        self.default_options["vmin"] = self._log_floored_vmin(
            arr,
            self.vmin,
            vmin_pinned=self._vmin_explicit,
            ticks_spacing_pinned=(
                "ticks_spacing" in kwargs or "ticks_spacing" in resolved_colorbar
            ),
        )
        self.default_options["vmax"] = self.vmax

        ticks = self.get_ticks()
        # Resolve the norm ONCE here, before any axes mutation: it surfaces a
        # bad `color_scale` / `scheme` (rolling the whole group merge back so
        # a failed classified plot leaves no half-applied option on this
        # sticky-options glyph), emits any scheme/scale conflict warning
        # exactly once with the caller's `plot(...)` as the attributed frame,
        # and is handed to the render site so classification (incl. the Jenks
        # DP) is not recomputed.
        try:
            norm, cbar_kw, ticks = self._norm_cbar_and_ticks(ticks)
        except (ValueError, TypeError):
            for key, value in pre_group_opts.items():
                self.default_options[key] = value
            raise
        projection = self.default_options.get("projection")
        if projection and (
            self._coords is None
            or self._coords[0].ndim != 1
            or self._coords[1].ndim != 1
        ):
            raise ValueError(
                "projection= requires 1-D lon/lat coordinate vectors (build "
                "the glyph with coords=(lon, lat)); an extent-only or "
                "2-D-coordinate array cannot be reprojected."
            )
        _clear_prior_render_artists(ax, self, compose=compose)
        if not compose:
            self._sync_projection_frame(projection_draws_frame(projection))
        if projection:
            if points is not None or self.default_options.get("display_cell_value"):
                warnings.warn(
                    "'projection' draws point / cell-value overlays at raw grid "
                    "indices, not reprojected coordinates, so they are misplaced "
                    "under a projection; omit them when using 'projection'.",
                    stacklevel=2,
                )
            if kind not in ("auto", "pcolormesh") or self.default_options.get(
                "hillshade"
            ):
                warnings.warn(
                    "'projection' always renders via pcolormesh and ignores "
                    "'kind' and 'hillshade'.",
                    stacklevel=2,
                )
            im, cbar_kw = self._plot_projected(ax, arr, norm, cbar_kw, ticks)
        else:
            im, cbar_kw = self._plot_im_get_cbar_kw(
                ax, arr, norm, cbar_kw, ticks, kind=effective_kind
            )
        self.im = im

        self.cbar = None
        degenerate_contour = (
            effective_kind == "contour" and self._vmax == self._vmin
        )
        unfilled_contourf = (
            effective_kind == "contourf"
            and self.default_options.get("fill") is False
        )
        if self._draws_own_colorbar(compose, colorbar):
            if degenerate_contour:
                warnings.warn(
                    "Constant-value field has no contour lines; skipping "
                    "the colorbar for kind='contour'.",
                    stacklevel=2,
                )
            elif unfilled_contourf:
                # An unfilled (colors="none") set is not colour-mapped, so
                # there is nothing to colorbar -- the hatch-overlay form.
                # Warn only if the caller explicitly asked for one, so the
                # dropped request is not silent.
                if colorbar is not None or "add_colorbar" in getattr(
                    self,
                    "_render_explicit_options",
                    getattr(self, "_explicit_options", set()),
                ):
                    warnings.warn(
                        "An unfilled contourf overlay (fill=False) is not "
                        "colour-mapped, so the requested colorbar is not "
                        "drawn.",
                        stacklevel=2,
                    )
            else:
                self.cbar = self.create_color_bar(ax, im, cbar_kw)

    # A composed overlay must not retitle the host. This glyph's title is
    # empty unless it was given one, and setting that over the host's would
    # blank a caption the host put there.
    if not compose or self.default_options["title"]:
        ax.set_title(
            self.default_options["title"],
            fontsize=self.default_options["title_size"],
            pad=_multiline_title_pad(
                ax,
                self.default_options["title"],
                self.default_options["title_size"],
            ),
        )
    # Row/column indices are meaningless axis labels, so a pixel-space
    # render hides them -- but only on an axes it owns. Composed onto a
    # host, stripping the host's ticks is not this overlay's call. Runs
    # before the axis styling so a caller's `xtick_font_size` is not applied
    # to ticks that are about to be deleted.
    if not compose and self.extent is None and effective_kind == "imshow":
        ax.set_xticklabels([])
        ax.set_yticklabels([])
        ax.set_xticks([])
        ax.set_yticks([])

    self._apply_axis_style(ax)

    supports_overlay = effective_kind in ("imshow", "pcolormesh")
    optional_display: dict[str, Any] = {}
    if self.default_options["display_cell_value"] and supports_overlay:
        indices = get_indices2(arr, [np.nan])
        optional_display["cell_text_value"] = self._plot_text(
            ax, arr, indices, self.default_options
        )

    if points is not None and supports_overlay:
        _, _, points_scatter, points_labels = points.draw(ax)
        optional_display["points_scatter"] = points_scatter
        optional_display["points_id"] = points_labels

    _mark_render_artists(
        ax,
        self,
        self.cbar,
        self.im,
        optional_display.get("points_scatter"),
        *(optional_display.get("points_id") or []),
        *(optional_display.get("cell_text_value") or []),
    )
    if basemap is not None:
        self._draw_basemap(basemap)
    if full_bleed:
        self._apply_full_bleed(
            facecolor=full_bleed if isinstance(full_bleed, str) else None
        )
    elif getattr(self, "_auto_figure", False):
        self._tighten_figure()
    return fig, ax

prepare_array(array, rgb=None, surface_reflectance=None, cutoff=None, percentile=None) #

Prepare an array for RGB visualization.

This method processes a multi-band array to create an RGB image suitable for visualization. It can normalize the data using either percentile-based scaling or surface reflectance values.

Parameters:

Name Type Description Default
array ndarray

The input array containing multiple bands. For RGB visualization, this should be a 3D array where the first dimension represents the bands.

required
rgb list[int] | None

The [r, g, b] indices of the bands to composite from the input array. Provide the band indices explicitly; there is no functional default -- a missing rgb does not select bands.

None
surface_reflectance int | None

Surface reflectance value for normalizing satellite data, by default None. Typically 10000 for Sentinel-2 data or 255 for 8-bit imagery. Used to scale values to the range [0, 1].

None
cutoff list | None

Clip the range of pixel values for each band, by default None. Takes only pixel values from 0 to the value of the cutoff and scales them back to between 0 and 1. Should be a list with one value per band.

None
percentile int | None

The percentile value to be used for scaling the array values, by default None. Used to enhance contrast by stretching the histogram. If provided, this takes precedence over surface_reflectance.

None

Returns:

Type Description
ndarray

np.ndarray: The prepared array with shape (height, width, 3) suitable for RGB visualization. Values are normalized to the range [0, 1]. the rgb 3d array is converted into 2d array to be plotted using the plt.imshow function. a float32 array normalized between 0 and 1 using the percentile values or the surface_reflectance. if the percentile or surface_reflectance values are not given, the function just reorders the values to have the red-green-blue order.

Raises:

Type Description
ValueError

If the array shape is incompatible with the provided RGB indices.

Notes
  • The prepare_array function is called in the constructor of the ArrayGlyph class to prepare the array, so you can provide the same parameters of the prepare_array function to the ArrayGlyph constructor.
  • The prepare function moves the first axes (the channel axis) to the last axes, and then scales the array using the percentile values. If the percentile is not given, the function scales the array using the surface reflectance values. If the surface reflectance is not given, the function scales the array using the cutoff values. If the cutoff is not given, the function scales the array using the sentinel data

Examples:

Prepare an array using percentile-based scaling:

>>> import numpy as np
>>> from cleopatra.glyphs.gridded.array_glyph import ArrayGlyph
>>> # Create a 3-band array (e.g., satellite image)
>>> bands = np.random.randint(0, 10000, size=(3, 100, 100))
>>> glyph = ArrayGlyph(np.zeros((1, 1)))  # Dummy initialization
>>> rgb_array = glyph.prepare_array(bands, rgb=[0, 1, 2], percentile=2)
>>> rgb_array.shape
(100, 100, 3)
>>> np.all((0 <= rgb_array) & (rgb_array <= 1))
np.True_
Prepare an array using surface reflectance normalization:
>>> rgb_array = glyph.prepare_array(bands, rgb=[0, 1, 2], surface_reflectance=10000)
>>> rgb_array.shape
(100, 100, 3)
>>> np.all((0 <= rgb_array) & (rgb_array <= 1))
np.True_
Prepare an array with cutoff values:
>>> rgb_array = glyph.prepare_array(
...     bands, rgb=[0, 1, 2], surface_reflectance=10000, cutoff=[0.3, 0.3, 0.3]
... )
>>> rgb_array.shape
(100, 100, 3)
>>> np.all((0 <= rgb_array) & (rgb_array <= 1))
np.True_

  • Create an array and instantiate the ArrayGlyph class.
    >>> import numpy as np
    >>> arr = np.random.randint(0, 255, size=(3, 5, 5)).astype(np.float32)
    >>> array_glyph = ArrayGlyph(arr)
    >>> print(array_glyph.arr.shape)
    (3, 5, 5)
    
    rgb channels:
    • Now let's use the prepare_array function with rgb channels as [0, 1, 2]. so the finction does not to reorder the chennels. but it just needs to move the first axis to the last axis.
      >>> rgb_array = array_glyph.prepare_array(arr, rgb=[0, 1, 2])
      >>> print(rgb_array.shape)
      (5, 5, 3)
      
    • If we compare the values of the first channel in the original array with the first array in the rgb array it should be the same.
      >>> np.testing.assert_equal(arr[0, :, :],rgb_array[:, :, 0])
      
      surface_reflectance:
    • if you provide the surface reflectance value, the function will scale the array using the surface reflectance value to a normalized rgb values.
      >>> array_glyph = ArrayGlyph(arr)
      >>> rgb_array = array_glyph.prepare_array(arr, surface_reflectance=10000, rgb=[0, 1, 2])
      >>> print(rgb_array.shape)
      (5, 5, 3)
      
    • if you print the values of the first channel, you will find all the values are between 0 and 1.
      >>> print(rgb_array[:, :, 0]) # doctest: +SKIP
      [[0.0195 0.02   0.0109 0.0211 0.0087]
       [0.0112 0.0221 0.0035 0.0234 0.0141]
       [0.0116 0.0188 0.0001 0.0176 0.    ]
       [0.0014 0.0147 0.0043 0.0167 0.0117]
       [0.0083 0.0139 0.0186 0.02   0.0058]]
      
    • With the surface_reflectance parameter, you can also use the cutoff parameter to affect values that are above it, by rescaling them.
      >>> rgb_array = array_glyph.prepare_array(
      ...     arr, surface_reflectance=10000, rgb=[0, 1, 2], cutoff=[0.8, 0.8, 0.8]
      ... )
      >>> print(rgb_array[:, :, 0]) # doctest: +SKIP
      [[0.     0.     0.     0.     0.    ]
       [1.     1.     1.     1.     1.    ]
       [1.     1.     1.     1.     1.    ]
       [0.0014 0.0147 0.0043 0.0167 0.0117]
       [0.0083 0.0139 0.0186 0.02   0.0058]]
      
Source code in src/cleopatra/glyphs/gridded/array_glyph.py
def prepare_array(
    self,
    array: np.ndarray,
    rgb: list[int] | None = None,
    surface_reflectance: int | None = None,
    cutoff: list | None = None,
    percentile: int | None = None,
) -> np.ndarray:
    """Prepare an array for RGB visualization.

    This method processes a multi-band array to create an RGB image suitable for visualization.
    It can normalize the data using either percentile-based scaling or surface reflectance values.

    Args:
        array: The input array containing multiple bands. For RGB visualization,
            this should be a 3D array where the first dimension represents the bands.
        rgb: The `[r, g, b]` indices of the bands to composite from the input
            array. Provide the band indices explicitly; there is no
            functional default -- a missing `rgb` does not select bands.
        surface_reflectance: Surface reflectance value for normalizing satellite data, by default None.
            Typically 10000 for Sentinel-2 data or 255 for 8-bit imagery.
            Used to scale values to the range [0, 1].
        cutoff: Clip the range of pixel values for each band, by default None.
            Takes only pixel values from 0 to the value of the cutoff and scales them back to between 0 and 1.
            Should be a list with one value per band.
        percentile: The percentile value to be used for scaling the array values, by default None.
            Used to enhance contrast by stretching the histogram.
            If provided, this takes precedence over surface_reflectance.

    Returns:
        np.ndarray: The prepared array with shape (height, width, 3) suitable for RGB visualization.
            Values are normalized to the range [0, 1].
            the rgb 3d array is converted into 2d array to be plotted using the plt.imshow function.
            a float32 array normalized between 0 and 1 using the `percentile` values or the `surface_reflectance`.
            if the `percentile` or `surface_reflectance` values are not given, the function just reorders the values
            to have the red-green-blue order.

    Raises:
        ValueError: If the array shape is incompatible with the provided RGB indices.

    Notes:
        - The `prepare_array` function is called in the constructor of the `ArrayGlyph` class to prepare the array,
          so you can provide the same parameters of the `prepare_array` function to the `ArrayGlyph constructor`.
        - The prepare function moves the first axes (the channel axis) to the last axes, and then scales the array
          using the percentile values. If the percentile is not given, the function scales the array using the
          surface reflectance values. If the surface reflectance is not given, the function scales the array using
          the cutoff values. If the cutoff is not given, the function scales the array using the sentinel data

    Examples:
    Prepare an array using percentile-based scaling:
        ```python
        >>> import numpy as np
        >>> from cleopatra.glyphs.gridded.array_glyph import ArrayGlyph
        >>> # Create a 3-band array (e.g., satellite image)
        >>> bands = np.random.randint(0, 10000, size=(3, 100, 100))
        >>> glyph = ArrayGlyph(np.zeros((1, 1)))  # Dummy initialization
        >>> rgb_array = glyph.prepare_array(bands, rgb=[0, 1, 2], percentile=2)
        >>> rgb_array.shape
        (100, 100, 3)
        >>> np.all((0 <= rgb_array) & (rgb_array <= 1))
        np.True_

        ```
    Prepare an array using surface reflectance normalization:
        ```python
        >>> rgb_array = glyph.prepare_array(bands, rgb=[0, 1, 2], surface_reflectance=10000)
        >>> rgb_array.shape
        (100, 100, 3)
        >>> np.all((0 <= rgb_array) & (rgb_array <= 1))
        np.True_

        ```
    Prepare an array with cutoff values:
        ```python
        >>> rgb_array = glyph.prepare_array(
        ...     bands, rgb=[0, 1, 2], surface_reflectance=10000, cutoff=[0.3, 0.3, 0.3]
        ... )
        >>> rgb_array.shape
        (100, 100, 3)
        >>> np.all((0 <= rgb_array) & (rgb_array <= 1))
        np.True_

        ```

    - Create an array and instantiate the `ArrayGlyph` class.
        ```python
        >>> import numpy as np
        >>> arr = np.random.randint(0, 255, size=(3, 5, 5)).astype(np.float32)
        >>> array_glyph = ArrayGlyph(arr)
        >>> print(array_glyph.arr.shape)
        (3, 5, 5)

        ```
    `rgb` channels:
        - Now let's use the `prepare_array` function with `rgb` channels as [0, 1, 2]. so the finction does not to
            reorder the chennels. but it just needs to move the first axis to the last axis.
            ```python
            >>> rgb_array = array_glyph.prepare_array(arr, rgb=[0, 1, 2])
            >>> print(rgb_array.shape)
            (5, 5, 3)

            ```
        - If we compare the values of the first channel in the original array with the first array in the rgb array it
            should be the same.
            ```python
            >>> np.testing.assert_equal(arr[0, :, :],rgb_array[:, :, 0])

            ```
    surface_reflectance:
        - if you provide the surface reflectance value, the function will scale the array using the surface reflectance
            value to a normalized rgb values.
            ```python
            >>> array_glyph = ArrayGlyph(arr)
            >>> rgb_array = array_glyph.prepare_array(arr, surface_reflectance=10000, rgb=[0, 1, 2])
            >>> print(rgb_array.shape)
            (5, 5, 3)

            ```
        - if you print the values of the first channel, you will find all the values are between 0 and 1.
            ```python
            >>> print(rgb_array[:, :, 0]) # doctest: +SKIP
            [[0.0195 0.02   0.0109 0.0211 0.0087]
             [0.0112 0.0221 0.0035 0.0234 0.0141]
             [0.0116 0.0188 0.0001 0.0176 0.    ]
             [0.0014 0.0147 0.0043 0.0167 0.0117]
             [0.0083 0.0139 0.0186 0.02   0.0058]]

            ```
        - With the `surface_reflectance` parameter, you can also use the `cutoff` parameter to affect values that
            are above it, by rescaling them.
            ```python
            >>> rgb_array = array_glyph.prepare_array(
            ...     arr, surface_reflectance=10000, rgb=[0, 1, 2], cutoff=[0.8, 0.8, 0.8]
            ... )
            >>> print(rgb_array[:, :, 0]) # doctest: +SKIP
            [[0.     0.     0.     0.     0.    ]
             [1.     1.     1.     1.     1.    ]
             [1.     1.     1.     1.     1.    ]
             [0.0014 0.0147 0.0043 0.0167 0.0117]
             [0.0083 0.0139 0.0186 0.02   0.0058]]

            ```
    """
    return RgbBands(
        rgb,
        surface_reflectance=surface_reflectance,
        cutoff=cutoff,
        percentile=percentile,
    ).prepare(array)

scale_percentile(arr, percentile=1) staticmethod #

Scale an array using percentile-based contrast stretching.

This method enhances the contrast of an image by stretching the histogram based on percentile values. It calculates the lower and upper percentile values for each band and normalizes the data to the range [0, 1].

Parameters:

Name Type Description Default
arr ndarray

The array to be scaled, with shape (height, width, bands). Typically an RGB image with 3 bands.

required
percentile int

The percentile value to be used for scaling, by default 1. This value determines how much of the histogram tails to exclude. Higher values result in more contrast stretching. Typical values range from 1 to 5.

1

Returns:

Type Description
ndarray

np.ndarray: The scaled array, normalized between 0 and 1, with the same shape as input. Data type is float32.

Notes

The method works by: 1. Computing the lower percentile value for each band 2. Computing the upper percentile value (100 - percentile) for each band 3. Normalizing each band using these percentile values 4. Clipping values to the range [0, 1]

This is particularly useful for visualizing satellite imagery with high dynamic range.

Examples: Scale a single-band array:

>>> import numpy as np
>>> from cleopatra.glyphs.gridded.array_glyph import ArrayGlyph
>>> # Create a test array with values between 0 and 10000
>>> test_array = np.random.randint(0, 10000, size=(100, 100, 1))
>>> scaled = ArrayGlyph.scale_percentile(test_array, percentile=2)
>>> scaled.shape
(100, 100, 1)
>>> np.all((0 <= scaled) & (scaled <= 1))
np.True_
Scale an RGB array:
>>> rgb_array = np.random.randint(0, 10000, size=(100, 100, 3))
>>> scaled = ArrayGlyph.scale_percentile(rgb_array, percentile=2)
>>> scaled.shape
(100, 100, 3)
>>> np.all((0 <= scaled) & (scaled <= 1))
np.True_
Using different percentile values affects contrast:
>>> low_contrast = ArrayGlyph.scale_percentile(rgb_array, percentile=1)
>>> high_contrast = ArrayGlyph.scale_percentile(rgb_array, percentile=5)
>>> # Higher percentile typically results in higher contrast

Source code in src/cleopatra/glyphs/gridded/array_glyph.py
@staticmethod
def scale_percentile(arr: np.ndarray, percentile: int = 1) -> np.ndarray:
    """Scale an array using percentile-based contrast stretching.

    This method enhances the contrast of an image by stretching the histogram
    based on percentile values. It calculates the lower and upper percentile values
    for each band and normalizes the data to the range [0, 1].

    Args:
        arr: The array to be scaled, with shape (height, width, bands).
            Typically an RGB image with 3 bands.
        percentile: The percentile value to be used for scaling, by default 1.
            This value determines how much of the histogram tails to exclude.
            Higher values result in more contrast stretching.
            Typical values range from 1 to 5.

    Returns:
        np.ndarray: The scaled array, normalized between 0 and 1, with the same shape as input.
            Data type is float32.

    Notes:
        The method works by:
        1. Computing the lower percentile value for each band
        2. Computing the upper percentile value (100 - percentile) for each band
        3. Normalizing each band using these percentile values
        4. Clipping values to the range [0, 1]

        This is particularly useful for visualizing satellite imagery with high dynamic range.

    Examples:
    Scale a single-band array:
    ```python
    >>> import numpy as np
    >>> from cleopatra.glyphs.gridded.array_glyph import ArrayGlyph
    >>> # Create a test array with values between 0 and 10000
    >>> test_array = np.random.randint(0, 10000, size=(100, 100, 1))
    >>> scaled = ArrayGlyph.scale_percentile(test_array, percentile=2)
    >>> scaled.shape
    (100, 100, 1)
    >>> np.all((0 <= scaled) & (scaled <= 1))
    np.True_

    ```
    Scale an RGB array:
    ```python
    >>> rgb_array = np.random.randint(0, 10000, size=(100, 100, 3))
    >>> scaled = ArrayGlyph.scale_percentile(rgb_array, percentile=2)
    >>> scaled.shape
    (100, 100, 3)
    >>> np.all((0 <= scaled) & (scaled <= 1))
    np.True_

    ```
    Using different percentile values affects contrast:
    ```python
    >>> low_contrast = ArrayGlyph.scale_percentile(rgb_array, percentile=1)
    >>> high_contrast = ArrayGlyph.scale_percentile(rgb_array, percentile=5)
    >>> # Higher percentile typically results in higher contrast

    ```
    """
    rows, columns, bands = arr.shape
    arr = np.reshape(arr, [rows * columns, bands]).astype(np.float32)
    lower_percent = np.percentile(arr, percentile, axis=0)
    upper_percent = np.percentile(arr, 100 - percentile, axis=0) - lower_percent
    arr = (arr - lower_percent[None, :]) / upper_percent[None, :]
    arr = np.reshape(arr, [rows, columns, bands])
    arr = arr.clip(0, 1)

    return arr

scale_to_rgb(arr=None, per_band=False, percentile=(2.0, 98.0)) #

Scale an array to the 0-255 uint8 range for RGB rendering.

Two modes are available:

  • Global (default, per_band=False): scale the whole array by a single maximum (arr * 255 / arr.max()). Suitable for a single band or when all bands share a range.
  • Per-band percentile stretch (per_band=True): stretch each band (the last axis of a (rows, cols, bands) array) independently between its percentile low/high cut, clip to that range, and map to 0-255. This is the contrast stretch typically wanted for true RGB composites where bands have different dynamic ranges. A band with no usable range (all-NaN, or flat where the two cuts coincide) has nothing to stretch and is returned as a flat zero band.

Parameters:

Name Type Description Default
arr ndarray | None

Array to scale. If None, the glyph's own array is used. For per_band=True it must be 3-D (rows, cols, bands).

None
per_band bool

When True, stretch each band independently using percentile. When False (default), use the legacy single global-max scaling. Defaults to False.

False
percentile tuple[float, float]

(low, high) percentile cuts for the per-band stretch, by default (2.0, 98.0). Ignored when per_band is False.

(2.0, 98.0)

Returns:

Type Description
ndarray

np.ndarray: A uint8 array of the same shape as the input, with values in 0-255. The input array is not modified.

Raises:

Type Description
ValueError

If per_band=True and arr is not a 3-D (rows, cols, bands) array.

Examples:

  • Global scaling of a single band (default):
    >>> import numpy as np
    >>> arr = np.array([[1, 2, 3], [4, 5, 6], [7, 8, 9]])
    >>> array = ArrayGlyph(arr)
    >>> rgb_array = array.scale_to_rgb()
    >>> print(rgb_array)
    [[28 56 85]
     [113 141 170]
     [198 226 255]]
    >>> print(rgb_array.dtype)
    uint8
    
  • Per-band percentile stretch of a 3-band composite (each band spans the full 0-255 range independently):
    >>> import numpy as np
    >>> rng = np.random.default_rng(0)
    >>> stack = rng.uniform(10, 200, size=(8, 8, 3))
    >>> array = ArrayGlyph(np.zeros((4, 4)))   # any 2-D placeholder
    >>> out = array.scale_to_rgb(stack, per_band=True)
    >>> out.shape, out.dtype
    ((8, 8, 3), dtype('uint8'))
    >>> int(out[..., 0].min()), int(out[..., 0].max())
    (0, 255)
    
Source code in src/cleopatra/glyphs/gridded/array_glyph.py
def scale_to_rgb(
    self,
    arr: np.ndarray | None = None,
    per_band: bool = False,
    percentile: tuple[float, float] = (2.0, 98.0),
) -> np.ndarray:
    """Scale an array to the 0-255 ``uint8`` range for RGB rendering.

    Two modes are available:

    - **Global (default, `per_band=False`):** scale the whole array by a
      single maximum (`arr * 255 / arr.max()`). Suitable for a single
      band or when all bands share a range.
    - **Per-band percentile stretch (`per_band=True`):** stretch each band
      (the last axis of a ``(rows, cols, bands)`` array) independently
      between its `percentile` low/high cut, clip to that range, and map
      to 0-255. This is the contrast stretch typically wanted for true
      RGB composites where bands have different dynamic ranges. A band
      with no usable range (all-NaN, or flat where the two cuts coincide)
      has nothing to stretch and is returned as a flat zero band.

    Args:
        arr: Array to scale. If None, the glyph's own array is used.
            For `per_band=True` it must be 3-D ``(rows, cols, bands)``.
        per_band: When True, stretch each band independently using
            `percentile`. When False (default), use the legacy single
            global-max scaling. Defaults to False.
        percentile: ``(low, high)`` percentile cuts for the per-band
            stretch, by default ``(2.0, 98.0)``. Ignored when
            `per_band` is False.

    Returns:
        np.ndarray: A ``uint8`` array of the same shape as the input,
            with values in 0-255. The input array is not modified.

    Raises:
        ValueError: If `per_band=True` and `arr` is not a 3-D
            ``(rows, cols, bands)`` array.

    Examples:
        - Global scaling of a single band (default):
            ```python
            >>> import numpy as np
            >>> arr = np.array([[1, 2, 3], [4, 5, 6], [7, 8, 9]])
            >>> array = ArrayGlyph(arr)
            >>> rgb_array = array.scale_to_rgb()
            >>> print(rgb_array)
            [[28 56 85]
             [113 141 170]
             [198 226 255]]
            >>> print(rgb_array.dtype)
            uint8

            ```
        - Per-band percentile stretch of a 3-band composite (each band
          spans the full 0-255 range independently):
            ```python
            >>> import numpy as np
            >>> rng = np.random.default_rng(0)
            >>> stack = rng.uniform(10, 200, size=(8, 8, 3))
            >>> array = ArrayGlyph(np.zeros((4, 4)))   # any 2-D placeholder
            >>> out = array.scale_to_rgb(stack, per_band=True)
            >>> out.shape, out.dtype
            ((8, 8, 3), dtype('uint8'))
            >>> int(out[..., 0].min()), int(out[..., 0].max())
            (0, 255)

            ```
    """
    if arr is None:
        arr = self.arr

    if per_band:
        arr = np.asarray(arr, dtype="float64")
        if arr.ndim != 3:
            raise ValueError(
                "per_band=True requires a 3-D (rows, cols, bands) array; "
                f"got {arr.ndim}-D shape {arr.shape}."
            )
        lo_p, hi_p = percentile
        out = np.empty(arr.shape, dtype="float64")
        for band in range(arr.shape[-1]):
            values = arr[..., band]
            with warnings.catch_warnings():
                warnings.simplefilter("ignore", RuntimeWarning)
                lo, hi = np.nanpercentile(values, [lo_p, hi_p])
            if not (np.isfinite(lo) and np.isfinite(hi)) or hi <= lo:
                out[..., band] = 0.0
                continue
            out[..., band] = np.clip((values - lo) / (hi - lo), 0.0, 1.0)
        out = np.nan_to_num(out, nan=0.0)
        return (out * 255).astype("uint8")

    denominator = arr.max() or 1
    return (arr * 255 / denominator).astype("uint8")

to_image(arr=None) #

Create an RGB image from an array.

convert the array to an image.

Parameters:

Name Type Description Default
arr ndarray | None

array. if None, the array in the object will be used.

None

Returns:

Type Description
Image

PIL.Image.Image: An RGB image built from the array (values scaled to the 0-255 uint8 range unless already uint8).

Examples:

>>> import numpy as np
>>> arr = np.array([[1, 2, 3], [4, 5, 6], [7, 8, 9]])
>>> array = ArrayGlyph(arr)
>>> image = array.to_image()
>>> print(image) # doctest: +SKIP
<PIL.Image.Image image mode=RGB size=3x3 at 0x7F5E0D2F4C40>

Source code in src/cleopatra/glyphs/gridded/array_glyph.py
def to_image(self, arr: np.ndarray | None = None) -> Image.Image:
    """Create an RGB image from an array.

        convert the array to an image.

    Args:
        arr: array. if None, the array in the object will be used.

    Returns:
        PIL.Image.Image: An RGB image built from the array (values
            scaled to the 0-255 `uint8` range unless already `uint8`).

    Examples:
    ```python
    >>> import numpy as np
    >>> arr = np.array([[1, 2, 3], [4, 5, 6], [7, 8, 9]])
    >>> array = ArrayGlyph(arr)
    >>> image = array.to_image()
    >>> print(image) # doctest: +SKIP
    <PIL.Image.Image image mode=RGB size=3x3 at 0x7F5E0D2F4C40>

    ```
    """
    if arr is None:
        arr = self.arr
    arr = arr if arr.dtype == "uint8" else self.scale_to_rgb()
    return Image.fromarray(arr).convert("RGB")

FacetGrid#

ArrayGlyph.facet(...) returns a FacetGrid result object (it mirrors xarray's FacetGrid): a shared fig, a 2-D ndarray of axes, the shared cbar, and name_dicts (one {dim: value} per panel).

cleopatra.glyphs.gridded.array_glyph.FacetGrid #

Result object for a multi-subplot facet plot.

Mirrors xarray's xarray.plot.facetgrid.FacetGrid return shape so downstream code that already targets xarray can be reused without changes. Produced by ArrayGlyph.facet; do not construct directly.

Attributes:

Name Type Description
fig

The shared matplotlib.figure.Figure.

axes

2-D ndarray of matplotlib.axes.Axes. Empty subplot slots (when col_wrap does not divide the stack evenly) are hidden via Axes.set_visible.

cbar

The shared matplotlib.colorbar.Colorbar attached to the first rendered subplot. None when faceting an RGB stack (no colorbar in the RGB path).

name_dicts

List of {dim_name: coord_value} dicts, one per rendered subplot. Mirrors xarray.plot.facetgrid.FacetGrid.name_dicts so callers can map subplot index to facet coordinate.

Examples:

  • Inspect the grid shape returned by ArrayGlyph.facet:
    >>> import numpy as np
    >>> from cleopatra.glyphs.gridded.array_glyph import (
    ...     ArrayGlyph,
    ...     FacetLayout,
    ... )
    >>> stack = np.arange(4 * 5 * 5, dtype=float).reshape(4, 5, 5)
    >>> g = ArrayGlyph(stack).facet(FacetLayout(col="t"))
    >>> g.axes.shape
    (1, 4)
    >>> len(g.name_dicts)
    4
    
Source code in src/cleopatra/glyphs/gridded/array_glyph.py
class FacetGrid:
    """Result object for a multi-subplot facet plot.

    Mirrors xarray's `xarray.plot.facetgrid.FacetGrid` return
    shape so downstream code that already targets xarray can be reused
    without changes. Produced by `ArrayGlyph.facet`; do not
    construct directly.

    Attributes:
        fig: The shared `matplotlib.figure.Figure`.
        axes: 2-D `ndarray` of `matplotlib.axes.Axes`. Empty
            subplot slots (when `col_wrap` does not divide the stack
            evenly) are hidden via `Axes.set_visible`.
        cbar: The shared `matplotlib.colorbar.Colorbar` attached
            to the first rendered subplot. `None` when faceting an
            RGB stack (no colorbar in the RGB path).
        name_dicts: List of `{dim_name: coord_value}` dicts, one per
            rendered subplot. Mirrors
            `xarray.plot.facetgrid.FacetGrid.name_dicts` so
            callers can map subplot index to facet coordinate.

    Examples:
        - Inspect the grid shape returned by `ArrayGlyph.facet`:
            ```python
            >>> import numpy as np
            >>> from cleopatra.glyphs.gridded.array_glyph import (
            ...     ArrayGlyph,
            ...     FacetLayout,
            ... )
            >>> stack = np.arange(4 * 5 * 5, dtype=float).reshape(4, 5, 5)
            >>> g = ArrayGlyph(stack).facet(FacetLayout(col="t"))
            >>> g.axes.shape
            (1, 4)
            >>> len(g.name_dicts)
            4

            ```
    """

    def __init__(
        self,
        fig: Figure,
        axes: np.ndarray,
        cbar: Colorbar | None,
        name_dicts: list[dict[str, Any]],
    ) -> None:
        """Initialise the `FacetGrid` result object.

        `ArrayGlyph.facet` is the only intended caller. End users
        receive an already-populated instance and should not invoke
        this constructor directly.

        Args:
            fig: The shared `matplotlib.figure.Figure` that owns
                every subplot.
            axes: 2-D `ndarray` of `matplotlib.axes.Axes` with
                shape `(nrows, ncols)`. Empty slots (when `col_wrap`
                does not divide the panel count evenly) are kept in the
                array but hidden with `Axes.set_visible(False)`.
            cbar: The shared `matplotlib.colorbar.Colorbar` for
                the grid, attached to the first rendered subplot;
                `None` for an RGB facet that has no colorbar.
            name_dicts: One `{dim_name: coord_value}` dict per
                rendered subplot, in row-major (left-to-right,
                top-to-bottom) order, mirroring
                `xarray.plot.facetgrid.FacetGrid.name_dicts`.

        Examples:
            - The result-object fields line up with the keyword args
                used to construct it:
                ```python
                >>> import matplotlib.pyplot as plt
                >>> from cleopatra.glyphs.gridded.array_glyph import FacetGrid
                >>> fig, axes = plt.subplots(1, 2, squeeze=False)
                >>> grid = FacetGrid(
                ...     fig=fig,
                ...     axes=axes,
                ...     cbar=None,
                ...     name_dicts=[{"t": 0}, {"t": 1}],
                ... )
                >>> grid.axes.shape
                (1, 2)
                >>> grid.cbar is None
                True
                >>> [d["t"] for d in grid.name_dicts]
                [0, 1]
                >>> plt.close(fig)

                ```
        """
        self.fig = fig
        self.axes = axes
        self.cbar = cbar
        self.name_dicts = name_dicts

__init__(fig, axes, cbar, name_dicts) #

Initialise the FacetGrid result object.

ArrayGlyph.facet is the only intended caller. End users receive an already-populated instance and should not invoke this constructor directly.

Parameters:

Name Type Description Default
fig Figure

The shared matplotlib.figure.Figure that owns every subplot.

required
axes ndarray

2-D ndarray of matplotlib.axes.Axes with shape (nrows, ncols). Empty slots (when col_wrap does not divide the panel count evenly) are kept in the array but hidden with Axes.set_visible(False).

required
cbar Colorbar | None

The shared matplotlib.colorbar.Colorbar for the grid, attached to the first rendered subplot; None for an RGB facet that has no colorbar.

required
name_dicts list[dict[str, Any]]

One {dim_name: coord_value} dict per rendered subplot, in row-major (left-to-right, top-to-bottom) order, mirroring xarray.plot.facetgrid.FacetGrid.name_dicts.

required

Examples:

  • The result-object fields line up with the keyword args used to construct it:
    >>> import matplotlib.pyplot as plt
    >>> from cleopatra.glyphs.gridded.array_glyph import FacetGrid
    >>> fig, axes = plt.subplots(1, 2, squeeze=False)
    >>> grid = FacetGrid(
    ...     fig=fig,
    ...     axes=axes,
    ...     cbar=None,
    ...     name_dicts=[{"t": 0}, {"t": 1}],
    ... )
    >>> grid.axes.shape
    (1, 2)
    >>> grid.cbar is None
    True
    >>> [d["t"] for d in grid.name_dicts]
    [0, 1]
    >>> plt.close(fig)
    
Source code in src/cleopatra/glyphs/gridded/array_glyph.py
def __init__(
    self,
    fig: Figure,
    axes: np.ndarray,
    cbar: Colorbar | None,
    name_dicts: list[dict[str, Any]],
) -> None:
    """Initialise the `FacetGrid` result object.

    `ArrayGlyph.facet` is the only intended caller. End users
    receive an already-populated instance and should not invoke
    this constructor directly.

    Args:
        fig: The shared `matplotlib.figure.Figure` that owns
            every subplot.
        axes: 2-D `ndarray` of `matplotlib.axes.Axes` with
            shape `(nrows, ncols)`. Empty slots (when `col_wrap`
            does not divide the panel count evenly) are kept in the
            array but hidden with `Axes.set_visible(False)`.
        cbar: The shared `matplotlib.colorbar.Colorbar` for
            the grid, attached to the first rendered subplot;
            `None` for an RGB facet that has no colorbar.
        name_dicts: One `{dim_name: coord_value}` dict per
            rendered subplot, in row-major (left-to-right,
            top-to-bottom) order, mirroring
            `xarray.plot.facetgrid.FacetGrid.name_dicts`.

    Examples:
        - The result-object fields line up with the keyword args
            used to construct it:
            ```python
            >>> import matplotlib.pyplot as plt
            >>> from cleopatra.glyphs.gridded.array_glyph import FacetGrid
            >>> fig, axes = plt.subplots(1, 2, squeeze=False)
            >>> grid = FacetGrid(
            ...     fig=fig,
            ...     axes=axes,
            ...     cbar=None,
            ...     name_dicts=[{"t": 0}, {"t": 1}],
            ... )
            >>> grid.axes.shape
            (1, 2)
            >>> grid.cbar is None
            True
            >>> [d["t"] for d in grid.name_dicts]
            [0, 1]
            >>> plt.close(fig)

            ```
    """
    self.fig = fig
    self.axes = axes
    self.cbar = cbar
    self.name_dicts = name_dicts

Grouped input objects#

ArrayGlyph's plot() / animate() / facet() accept these typed objects (importable from cleopatra.glyphs.gridded.array_glyph) in place of the loose keyword arguments they replaced: rgb_bands=RgbBands(...) for RGB compositing, points=PointOverlay(...) for a point overlay, playback=Animation(...) for the animate playback settings (frame interval, the frame_label=FrameLabel(...) time label, cell_value_text_colors, and the lazy data_getter), and labels=PanelLabels(...) to title facet panels by coordinate.

cleopatra.glyphs.gridded.array_glyph.RgbBands #

Band selection and stretch for an RGB ArrayGlyph.

Bundles the four RGB data-preparation parameters -- the band indices and the mutually-exclusive stretch controls (surface_reflectance, cutoff, percentile) -- that ArrayGlyph.__init__ previously accepted as four separate keywords. Pass an instance as ArrayGlyph(array, rgb_bands=...); it is only meaningful in RGB mode (the plain single-band path takes no rgb_bands).

Attributes:

Name Type Description
indices

The [r, g, b] (or 4-band [r, g, b, a]) indices to pull from the input array's first (band) axis.

surface_reflectance

Reflectance scale to normalise by (e.g. 10000 for Sentinel-2, 255 for 8-bit imagery). None (default) skips reflectance normalisation.

cutoff

Per-band clip cutoffs applied on the reflectance path, one value per band. None (default) applies none.

percentile

Percentile for contrast-stretching the histogram; takes precedence over surface_reflectance when set. None (default) skips it.

Examples:

  • Band selection with a percentile stretch:
    >>> import numpy as np
    >>> from cleopatra.glyphs.gridded.array_glyph import ArrayGlyph, RgbBands
    >>> arr = np.random.default_rng(0).integers(0, 10000, size=(3, 8, 8)).astype(float)
    >>> glyph = ArrayGlyph(arr, rgb_bands=RgbBands([0, 1, 2], percentile=2))
    >>> glyph.rgb
    True
    
Source code in src/cleopatra/glyphs/gridded/array_glyph.py
class RgbBands:
    """Band selection and stretch for an RGB `ArrayGlyph`.

    Bundles the four RGB data-preparation parameters -- the band `indices`
    and the mutually-exclusive stretch controls (`surface_reflectance`,
    `cutoff`, `percentile`) -- that `ArrayGlyph.__init__` previously accepted
    as four separate keywords. Pass an instance as
    `ArrayGlyph(array, rgb_bands=...)`; it is only meaningful in RGB mode (the
    plain single-band path takes no `rgb_bands`).

    Attributes:
        indices: The `[r, g, b]` (or 4-band `[r, g, b, a]`) indices to pull
            from the input array's first (band) axis.
        surface_reflectance: Reflectance scale to normalise by (e.g. `10000`
            for Sentinel-2, `255` for 8-bit imagery). `None` (default) skips
            reflectance normalisation.
        cutoff: Per-band clip cutoffs applied on the reflectance path, one
            value per band. `None` (default) applies none.
        percentile: Percentile for contrast-stretching the histogram; takes
            precedence over `surface_reflectance` when set. `None` (default)
            skips it.

    Examples:
        - Band selection with a percentile stretch:
            ```python
            >>> import numpy as np
            >>> from cleopatra.glyphs.gridded.array_glyph import ArrayGlyph, RgbBands
            >>> arr = np.random.default_rng(0).integers(0, 10000, size=(3, 8, 8)).astype(float)
            >>> glyph = ArrayGlyph(arr, rgb_bands=RgbBands([0, 1, 2], percentile=2))
            >>> glyph.rgb
            True

            ```
    """

    def __init__(
        self,
        indices: list[int],
        *,
        surface_reflectance: int | None = None,
        cutoff: list | None = None,
        percentile: int | None = None,
    ) -> None:
        """Initialise an `RgbBands`.

        Args:
            indices: The `[r, g, b]` band indices in the input array.
            surface_reflectance: Reflectance scale to normalise by, or `None`.
            cutoff: Per-band clip cutoffs, or `None`.
            percentile: Percentile stretch (wins over `surface_reflectance`),
                or `None`.
        """
        self.indices = indices
        self.surface_reflectance = surface_reflectance
        self.cutoff = cutoff
        self.percentile = percentile

    def validate(self, array: np.ndarray) -> None:
        """Check the input array has enough bands for RGB compositing.

        Args:
            array: The band-first input array to be composited.

        Raises:
            ValueError: If the array has fewer than 3 bands on its first axis.

        Examples:
            - A 3-band array validates; a 2-band array is rejected:
                ```python
                >>> import numpy as np
                >>> from cleopatra.glyphs.gridded.array_glyph import RgbBands
                >>> RgbBands([0, 1, 2]).validate(np.zeros((3, 4, 4)))
                >>> RgbBands([0, 1, 2]).validate(np.zeros((2, 4, 4)))
                Traceback (most recent call last):
                    ...
                ValueError: RgbBands needs an array with at least 3 bands, got 2.

                ```
        """
        if array.shape[0] < 3:
            raise ValueError(
                f"RgbBands needs an array with at least 3 bands, got {array.shape[0]}."
            )

    def prepare(self, array: np.ndarray) -> np.ndarray:
        """Composite and stretch `array` into a displayable RGB image.

        Selects `indices` from the band axis and moves bands last, then applies
        the stretch: `percentile` (contrast stretch) wins, else
        `surface_reflectance` (with optional `cutoff`), else the bands are just
        reordered.

        Args:
            array: The band-first input array.

        Returns:
            np.ndarray: An `(H, W, 3)` array; normalised to `[0, 1]` when a
                stretch was applied.

        Raises:
            ValueError: If `indices` is `None` (no bands to select).

        Examples:
            - Select and reorder three bands into a band-last image:
                ```python
                >>> import numpy as np
                >>> from cleopatra.glyphs.gridded.array_glyph import RgbBands
                >>> arr = np.arange(12, dtype=float).reshape(3, 2, 2)
                >>> out = RgbBands([2, 1, 0]).prepare(arr)
                >>> out.shape
                (2, 2, 3)
                >>> bool((out[..., 0] == arr[2]).all())
                True

                ```
        """
        if self.indices is None:
            raise ValueError(
                "RgbBands.indices must be the [r, g, b] band indices, got None."
            )
        array = array[self.indices].transpose(1, 2, 0)
        if self.percentile is not None:
            return ArrayGlyph.scale_percentile(array, percentile=self.percentile)
        if self.surface_reflectance is not None:
            return self._apply_surface_reflectance(array)
        return array

    def _apply_surface_reflectance(self, array: np.ndarray) -> np.ndarray:
        """Normalise by `surface_reflectance`, then apply the optional `cutoff`.

        With a `cutoff`, each band's normalised data is clipped to
        `[0, cutoff[band]]` and rescaled back to `[0, 1]` (a per-band contrast
        stretch), one cutoff value per band.

        Args:
            array: The `(H, W, 3)` band-last array to normalise.

        Returns:
            np.ndarray: The normalised array, clipped to `[0, 1]`.
        """
        array = np.clip(array / self.surface_reflectance, 0, 1)
        if self.cutoff is not None:
            for band, limit in enumerate(self.cutoff):
                array[..., band] = np.clip(array[..., band], 0, limit) / limit
        return array

__init__(indices, *, surface_reflectance=None, cutoff=None, percentile=None) #

Initialise an RgbBands.

Parameters:

Name Type Description Default
indices list[int]

The [r, g, b] band indices in the input array.

required
surface_reflectance int | None

Reflectance scale to normalise by, or None.

None
cutoff list | None

Per-band clip cutoffs, or None.

None
percentile int | None

Percentile stretch (wins over surface_reflectance), or None.

None
Source code in src/cleopatra/glyphs/gridded/array_glyph.py
def __init__(
    self,
    indices: list[int],
    *,
    surface_reflectance: int | None = None,
    cutoff: list | None = None,
    percentile: int | None = None,
) -> None:
    """Initialise an `RgbBands`.

    Args:
        indices: The `[r, g, b]` band indices in the input array.
        surface_reflectance: Reflectance scale to normalise by, or `None`.
        cutoff: Per-band clip cutoffs, or `None`.
        percentile: Percentile stretch (wins over `surface_reflectance`),
            or `None`.
    """
    self.indices = indices
    self.surface_reflectance = surface_reflectance
    self.cutoff = cutoff
    self.percentile = percentile

prepare(array) #

Composite and stretch array into a displayable RGB image.

Selects indices from the band axis and moves bands last, then applies the stretch: percentile (contrast stretch) wins, else surface_reflectance (with optional cutoff), else the bands are just reordered.

Parameters:

Name Type Description Default
array ndarray

The band-first input array.

required

Returns:

Type Description
ndarray

np.ndarray: An (H, W, 3) array; normalised to [0, 1] when a stretch was applied.

Raises:

Type Description
ValueError

If indices is None (no bands to select).

Examples:

  • Select and reorder three bands into a band-last image:
    >>> import numpy as np
    >>> from cleopatra.glyphs.gridded.array_glyph import RgbBands
    >>> arr = np.arange(12, dtype=float).reshape(3, 2, 2)
    >>> out = RgbBands([2, 1, 0]).prepare(arr)
    >>> out.shape
    (2, 2, 3)
    >>> bool((out[..., 0] == arr[2]).all())
    True
    
Source code in src/cleopatra/glyphs/gridded/array_glyph.py
def prepare(self, array: np.ndarray) -> np.ndarray:
    """Composite and stretch `array` into a displayable RGB image.

    Selects `indices` from the band axis and moves bands last, then applies
    the stretch: `percentile` (contrast stretch) wins, else
    `surface_reflectance` (with optional `cutoff`), else the bands are just
    reordered.

    Args:
        array: The band-first input array.

    Returns:
        np.ndarray: An `(H, W, 3)` array; normalised to `[0, 1]` when a
            stretch was applied.

    Raises:
        ValueError: If `indices` is `None` (no bands to select).

    Examples:
        - Select and reorder three bands into a band-last image:
            ```python
            >>> import numpy as np
            >>> from cleopatra.glyphs.gridded.array_glyph import RgbBands
            >>> arr = np.arange(12, dtype=float).reshape(3, 2, 2)
            >>> out = RgbBands([2, 1, 0]).prepare(arr)
            >>> out.shape
            (2, 2, 3)
            >>> bool((out[..., 0] == arr[2]).all())
            True

            ```
    """
    if self.indices is None:
        raise ValueError(
            "RgbBands.indices must be the [r, g, b] band indices, got None."
        )
    array = array[self.indices].transpose(1, 2, 0)
    if self.percentile is not None:
        return ArrayGlyph.scale_percentile(array, percentile=self.percentile)
    if self.surface_reflectance is not None:
        return self._apply_surface_reflectance(array)
    return array

validate(array) #

Check the input array has enough bands for RGB compositing.

Parameters:

Name Type Description Default
array ndarray

The band-first input array to be composited.

required

Raises:

Type Description
ValueError

If the array has fewer than 3 bands on its first axis.

Examples:

  • A 3-band array validates; a 2-band array is rejected:
    >>> import numpy as np
    >>> from cleopatra.glyphs.gridded.array_glyph import RgbBands
    >>> RgbBands([0, 1, 2]).validate(np.zeros((3, 4, 4)))
    >>> RgbBands([0, 1, 2]).validate(np.zeros((2, 4, 4)))
    Traceback (most recent call last):
        ...
    ValueError: RgbBands needs an array with at least 3 bands, got 2.
    
Source code in src/cleopatra/glyphs/gridded/array_glyph.py
def validate(self, array: np.ndarray) -> None:
    """Check the input array has enough bands for RGB compositing.

    Args:
        array: The band-first input array to be composited.

    Raises:
        ValueError: If the array has fewer than 3 bands on its first axis.

    Examples:
        - A 3-band array validates; a 2-band array is rejected:
            ```python
            >>> import numpy as np
            >>> from cleopatra.glyphs.gridded.array_glyph import RgbBands
            >>> RgbBands([0, 1, 2]).validate(np.zeros((3, 4, 4)))
            >>> RgbBands([0, 1, 2]).validate(np.zeros((2, 4, 4)))
            Traceback (most recent call last):
                ...
            ValueError: RgbBands needs an array with at least 3 bands, got 2.

            ```
    """
    if array.shape[0] < 3:
        raise ValueError(
            f"RgbBands needs an array with at least 3 bands, got {array.shape[0]}."
        )

cleopatra.glyphs.gridded.array_glyph.PointOverlay #

A point overlay for ArrayGlyph.plot/animate: locations plus styling.

Bundles the five point-overlay parameters (points, and the marker / value-label colour and size) that plot/animate previously accepted as five separate, identically-named arguments duplicated across both signatures. Pass an instance as plot(points=...) / animate(points=...) instead of the individual point_color / point_size / point_label_color / point_label_size keywords.

Attributes:

Name Type Description
points

(N, 3) array: first column the value to display at each point, second/third columns the point's row/column index in the underlying array.

color

Marker colour, by default "red". Any valid matplotlib colour string.

size

Marker size, by default 100.

label_color

Colour of the point-value text label drawn at each point, by default "blue".

label_size

Font size of the point-value text label, by default 10.

Examples:

  • Build an overlay and pass it to plot:
    >>> import numpy as np
    >>> from cleopatra.glyphs.gridded.array_glyph import ArrayGlyph, PointOverlay
    >>> arr = np.arange(9, dtype=float).reshape(3, 3)
    >>> overlay = PointOverlay(np.array([[5.0, 1, 1]]), color="black")
    >>> fig, ax = ArrayGlyph(arr).plot(points=overlay)
    >>> overlay.color
    'black'
    >>> overlay.size
    100
    
Source code in src/cleopatra/glyphs/gridded/array_glyph.py
class PointOverlay:
    """A point overlay for `ArrayGlyph.plot`/`animate`: locations plus styling.

    Bundles the five point-overlay parameters (`points`, and the marker /
    value-label colour and size) that `plot`/`animate` previously accepted
    as five separate, identically-named arguments duplicated across both
    signatures. Pass an instance as `plot(points=...)` /
    `animate(points=...)` instead of the individual `point_color` /
    `point_size` / `point_label_color` / `point_label_size` keywords.

    Attributes:
        points: `(N, 3)` array: first column the value to display at each
            point, second/third columns the point's row/column index in
            the underlying array.
        color: Marker colour, by default `"red"`. Any valid matplotlib
            colour string.
        size: Marker size, by default `100`.
        label_color: Colour of the point-value text label drawn at each
            point, by default `"blue"`.
        label_size: Font size of the point-value text label, by default
            `10`.

    Examples:
        - Build an overlay and pass it to `plot`:
            ```python
            >>> import numpy as np
            >>> from cleopatra.glyphs.gridded.array_glyph import ArrayGlyph, PointOverlay
            >>> arr = np.arange(9, dtype=float).reshape(3, 3)
            >>> overlay = PointOverlay(np.array([[5.0, 1, 1]]), color="black")
            >>> fig, ax = ArrayGlyph(arr).plot(points=overlay)
            >>> overlay.color
            'black'
            >>> overlay.size
            100

            ```
    """

    def __init__(
        self,
        points: np.ndarray,
        *,
        color: str = "red",
        size: int | float = 100,
        label_color: str = "blue",
        label_size: int | float = 10,
    ) -> None:
        """Initialise a `PointOverlay`.

        Args:
            points: `(N, 3)` array: value, row index, column index per point.
            color: Marker colour, by default `"red"`.
            size: Marker size, by default `100`.
            label_color: Point-value label colour, by default `"blue"`.
            label_size: Point-value label font size, by default `10`.
        """
        self.points = points
        self.color = color
        self.size = size
        self.label_color = label_color
        self.label_size = label_size

    def draw(self, ax) -> tuple:
        """Draw this overlay's markers and per-point value labels on `ax`.

        Owns the scatter-plus-value-label drawing that `ArrayGlyph.plot` and
        `.animate` share, reading only this overlay's own fields. The returned
        row/column arrays let `animate` reuse the same coordinates for its
        per-frame `set_offsets` updates without re-deriving them.

        Args:
            ax: The matplotlib axes to draw on.

        Returns:
            tuple: `(row, col, scatter, labels)` -- the point row and column
                index arrays, the marker `PathCollection`, and the list of
                per-point value-label `Text` artists (empty for no points).

        Examples:
            - Draw two points and read back the value labels:
                ```python
                >>> import matplotlib
                >>> matplotlib.use("Agg")
                >>> import matplotlib.pyplot as plt
                >>> import numpy as np
                >>> from cleopatra.glyphs.gridded.array_glyph import PointOverlay
                >>> fig, ax = plt.subplots()
                >>> overlay = PointOverlay(np.array([[5.0, 0, 0], [9.0, 1, 1]]))
                >>> row, col, scatter, labels = overlay.draw(ax)
                >>> len(labels)
                2
                >>> plt.close(fig)

                ```
        """
        row = self.points[:, 1]
        col = self.points[:, 2]
        scatter = ax.scatter(col, row, color=self.color, s=self.size)
        labels = [
            ax.text(
                point[2],
                point[1],
                point[0],
                ha="center",
                va="center",
                color=self.label_color,
                fontsize=self.label_size,
            )
            for point in self.points
        ]
        return row, col, scatter, labels

__init__(points, *, color='red', size=100, label_color='blue', label_size=10) #

Initialise a PointOverlay.

Parameters:

Name Type Description Default
points ndarray

(N, 3) array: value, row index, column index per point.

required
color str

Marker colour, by default "red".

'red'
size int | float

Marker size, by default 100.

100
label_color str

Point-value label colour, by default "blue".

'blue'
label_size int | float

Point-value label font size, by default 10.

10
Source code in src/cleopatra/glyphs/gridded/array_glyph.py
def __init__(
    self,
    points: np.ndarray,
    *,
    color: str = "red",
    size: int | float = 100,
    label_color: str = "blue",
    label_size: int | float = 10,
) -> None:
    """Initialise a `PointOverlay`.

    Args:
        points: `(N, 3)` array: value, row index, column index per point.
        color: Marker colour, by default `"red"`.
        size: Marker size, by default `100`.
        label_color: Point-value label colour, by default `"blue"`.
        label_size: Point-value label font size, by default `10`.
    """
    self.points = points
    self.color = color
    self.size = size
    self.label_color = label_color
    self.label_size = label_size

draw(ax) #

Draw this overlay's markers and per-point value labels on ax.

Owns the scatter-plus-value-label drawing that ArrayGlyph.plot and .animate share, reading only this overlay's own fields. The returned row/column arrays let animate reuse the same coordinates for its per-frame set_offsets updates without re-deriving them.

Parameters:

Name Type Description Default
ax

The matplotlib axes to draw on.

required

Returns:

Name Type Description
tuple tuple

(row, col, scatter, labels) -- the point row and column index arrays, the marker PathCollection, and the list of per-point value-label Text artists (empty for no points).

Examples:

  • Draw two points and read back the value labels:
    >>> import matplotlib
    >>> matplotlib.use("Agg")
    >>> import matplotlib.pyplot as plt
    >>> import numpy as np
    >>> from cleopatra.glyphs.gridded.array_glyph import PointOverlay
    >>> fig, ax = plt.subplots()
    >>> overlay = PointOverlay(np.array([[5.0, 0, 0], [9.0, 1, 1]]))
    >>> row, col, scatter, labels = overlay.draw(ax)
    >>> len(labels)
    2
    >>> plt.close(fig)
    
Source code in src/cleopatra/glyphs/gridded/array_glyph.py
def draw(self, ax) -> tuple:
    """Draw this overlay's markers and per-point value labels on `ax`.

    Owns the scatter-plus-value-label drawing that `ArrayGlyph.plot` and
    `.animate` share, reading only this overlay's own fields. The returned
    row/column arrays let `animate` reuse the same coordinates for its
    per-frame `set_offsets` updates without re-deriving them.

    Args:
        ax: The matplotlib axes to draw on.

    Returns:
        tuple: `(row, col, scatter, labels)` -- the point row and column
            index arrays, the marker `PathCollection`, and the list of
            per-point value-label `Text` artists (empty for no points).

    Examples:
        - Draw two points and read back the value labels:
            ```python
            >>> import matplotlib
            >>> matplotlib.use("Agg")
            >>> import matplotlib.pyplot as plt
            >>> import numpy as np
            >>> from cleopatra.glyphs.gridded.array_glyph import PointOverlay
            >>> fig, ax = plt.subplots()
            >>> overlay = PointOverlay(np.array([[5.0, 0, 0], [9.0, 1, 1]]))
            >>> row, col, scatter, labels = overlay.draw(ax)
            >>> len(labels)
            2
            >>> plt.close(fig)

            ```
    """
    row = self.points[:, 1]
    col = self.points[:, 2]
    scatter = ax.scatter(col, row, color=self.color, s=self.size)
    labels = [
        ax.text(
            point[2],
            point[1],
            point[0],
            ha="center",
            va="center",
            color=self.label_color,
            fontsize=self.label_size,
        )
        for point in self.points
    ]
    return row, col, scatter, labels

cleopatra.glyphs.gridded.array_glyph.FrameLabel #

Styling for the per-frame time label ArrayGlyph.animate draws.

Bundles the two frame-label parameters (location, color) that animate previously accepted as separate label_location / label_color arguments. Pass an instance as animate(playback=Animation(frame_label=...)) instead.

Attributes:

Name Type Description
location

[x, y] position for the label, by default None. When None, the label is anchored just inside the top-left corner using axes-fraction coordinates, so it stays clear of the top/bottom edges regardless of the array's shape or the axis orientation. A very narrow axes can still overflow horizontally at the default font size, since no anchor choice can fit a long label into less horizontal space than it needs; pass an explicit [x, y] (data coordinates) in that case.

color

Label text colour, by default "black". Any valid matplotlib colour string.

size

Label font size in points, by default None. When None, the label inherits the colorbar label size (cbar_label_size, 12 by default); pass a number to size the frame label independently of the colorbar.

Examples:

  • Build a frame label and pass it to animate:
    >>> import numpy as np
    >>> from cleopatra.glyphs.gridded.array_glyph import (
    ...     Animation,
    ...     ArrayGlyph,
    ...     FrameLabel,
    ... )
    >>> stack = np.arange(3 * 9, dtype=float).reshape(3, 3, 3)
    >>> label = FrameLabel(location=[0.1, 0.1], color="white")
    >>> glyph = ArrayGlyph(stack)
    >>> anim_obj = glyph.animate(
    ...     ["t0", "t1", "t2"], playback=Animation(frame_label=label)
    ... )
    >>> label.color
    'white'
    
Source code in src/cleopatra/glyphs/gridded/array_glyph.py
class FrameLabel:
    """Styling for the per-frame time label `ArrayGlyph.animate` draws.

    Bundles the two frame-label parameters (`location`, `color`) that
    `animate` previously accepted as separate `label_location` /
    `label_color` arguments. Pass an instance as
    `animate(playback=Animation(frame_label=...))` instead.

    Attributes:
        location: `[x, y]` position for the label, by default `None`.
            When `None`, the label is anchored just inside the top-left
            corner using axes-fraction coordinates, so it stays clear of
            the top/bottom edges regardless of the array's shape or the
            axis orientation. A very narrow axes can still overflow
            horizontally at the default font size, since no anchor choice
            can fit a long label into less horizontal space than it
            needs; pass an explicit `[x, y]` (data coordinates) in that
            case.
        color: Label text colour, by default `"black"`. Any valid
            matplotlib colour string.
        size: Label font size in points, by default `None`. When `None`,
            the label inherits the colorbar label size
            (`cbar_label_size`, `12` by default); pass a number to size
            the frame label independently of the colorbar.

    Examples:
        - Build a frame label and pass it to `animate`:
            ```python
            >>> import numpy as np
            >>> from cleopatra.glyphs.gridded.array_glyph import (
            ...     Animation,
            ...     ArrayGlyph,
            ...     FrameLabel,
            ... )
            >>> stack = np.arange(3 * 9, dtype=float).reshape(3, 3, 3)
            >>> label = FrameLabel(location=[0.1, 0.1], color="white")
            >>> glyph = ArrayGlyph(stack)
            >>> anim_obj = glyph.animate(
            ...     ["t0", "t1", "t2"], playback=Animation(frame_label=label)
            ... )
            >>> label.color
            'white'

            ```
    """

    def __init__(
        self,
        *,
        location: list[float] | None = None,
        color: str = "black",
        size: float | None = None,
    ) -> None:
        """Initialise a `FrameLabel`.

        Args:
            location: `[x, y]` label position, by default `None` (auto
                top-left anchor -- see the class docstring).
            color: Label text colour, by default `"black"`.
            size: Label font size in points, by default `None` (inherit
                the colorbar label size -- see the class docstring).
        """
        self.location = location
        self.color = color
        self.size = size

    def resolve_location(self) -> tuple[list[float], bool]:
        """Resolve the label anchor and whether it is the auto default.

        Returns:
            tuple: `(location, is_default)` -- the `[x, y]` anchor and a flag
                that is `True` when `location` was unset (the top-left
                axes-fraction default), which drives the transform and vertical
                alignment in `draw`.

        Examples:
            - An unset label auto-anchors top-left; an explicit one is kept:
                ```python
                >>> from cleopatra.glyphs.gridded.array_glyph import FrameLabel
                >>> FrameLabel().resolve_location()
                ([0.02, 0.95], True)
                >>> FrameLabel(location=[0.3, 0.4]).resolve_location()
                ([0.3, 0.4], False)

                ```
        """
        if self.location is None:
            return [0.02, 0.95], True
        return self.location, False

    def draw(self, ax, default_size: float):
        """Draw the (blank) per-frame label text artist on `ax`.

        Owns the placement / transform / alignment logic derived from this
        label's fields; the caller sets the text per frame on the returned
        artist. The auto default anchors in axes-fraction coordinates
        (top-left, `va="top"`); an explicit `location` uses data coordinates
        (`va="baseline"`).

        Args:
            ax: The matplotlib axes to draw on.
            default_size: Font size used when this label's own `size` is unset
                (the glyph passes its `cbar_label_size`).

        Returns:
            matplotlib.text.Text: The created label artist (initially blank).

        Examples:
            - Draw a label with its own size and read it back:
                ```python
                >>> import matplotlib
                >>> matplotlib.use("Agg")
                >>> import matplotlib.pyplot as plt
                >>> from cleopatra.glyphs.gridded.array_glyph import FrameLabel
                >>> fig, ax = plt.subplots()
                >>> text = FrameLabel(size=9).draw(ax, default_size=12)
                >>> text.get_fontsize()
                9.0
                >>> plt.close(fig)

                ```
        """
        location, is_default = self.resolve_location()
        return ax.text(
            location[0],
            location[1],
            " ",
            fontsize=self.size if self.size is not None else default_size,
            color=self.color,
            transform=ax.transAxes if is_default else ax.transData,
            va="top" if is_default else "baseline",
        )

__init__(*, location=None, color='black', size=None) #

Initialise a FrameLabel.

Parameters:

Name Type Description Default
location list[float] | None

[x, y] label position, by default None (auto top-left anchor -- see the class docstring).

None
color str

Label text colour, by default "black".

'black'
size float | None

Label font size in points, by default None (inherit the colorbar label size -- see the class docstring).

None
Source code in src/cleopatra/glyphs/gridded/array_glyph.py
def __init__(
    self,
    *,
    location: list[float] | None = None,
    color: str = "black",
    size: float | None = None,
) -> None:
    """Initialise a `FrameLabel`.

    Args:
        location: `[x, y]` label position, by default `None` (auto
            top-left anchor -- see the class docstring).
        color: Label text colour, by default `"black"`.
        size: Label font size in points, by default `None` (inherit
            the colorbar label size -- see the class docstring).
    """
    self.location = location
    self.color = color
    self.size = size

draw(ax, default_size) #

Draw the (blank) per-frame label text artist on ax.

Owns the placement / transform / alignment logic derived from this label's fields; the caller sets the text per frame on the returned artist. The auto default anchors in axes-fraction coordinates (top-left, va="top"); an explicit location uses data coordinates (va="baseline").

Parameters:

Name Type Description Default
ax

The matplotlib axes to draw on.

required
default_size float

Font size used when this label's own size is unset (the glyph passes its cbar_label_size).

required

Returns:

Type Description

matplotlib.text.Text: The created label artist (initially blank).

Examples:

  • Draw a label with its own size and read it back:
    >>> import matplotlib
    >>> matplotlib.use("Agg")
    >>> import matplotlib.pyplot as plt
    >>> from cleopatra.glyphs.gridded.array_glyph import FrameLabel
    >>> fig, ax = plt.subplots()
    >>> text = FrameLabel(size=9).draw(ax, default_size=12)
    >>> text.get_fontsize()
    9.0
    >>> plt.close(fig)
    
Source code in src/cleopatra/glyphs/gridded/array_glyph.py
def draw(self, ax, default_size: float):
    """Draw the (blank) per-frame label text artist on `ax`.

    Owns the placement / transform / alignment logic derived from this
    label's fields; the caller sets the text per frame on the returned
    artist. The auto default anchors in axes-fraction coordinates
    (top-left, `va="top"`); an explicit `location` uses data coordinates
    (`va="baseline"`).

    Args:
        ax: The matplotlib axes to draw on.
        default_size: Font size used when this label's own `size` is unset
            (the glyph passes its `cbar_label_size`).

    Returns:
        matplotlib.text.Text: The created label artist (initially blank).

    Examples:
        - Draw a label with its own size and read it back:
            ```python
            >>> import matplotlib
            >>> matplotlib.use("Agg")
            >>> import matplotlib.pyplot as plt
            >>> from cleopatra.glyphs.gridded.array_glyph import FrameLabel
            >>> fig, ax = plt.subplots()
            >>> text = FrameLabel(size=9).draw(ax, default_size=12)
            >>> text.get_fontsize()
            9.0
            >>> plt.close(fig)

            ```
    """
    location, is_default = self.resolve_location()
    return ax.text(
        location[0],
        location[1],
        " ",
        fontsize=self.size if self.size is not None else default_size,
        color=self.color,
        transform=ax.transAxes if is_default else ax.transData,
        va="top" if is_default else "baseline",
    )

resolve_location() #

Resolve the label anchor and whether it is the auto default.

Returns:

Name Type Description
tuple tuple[list[float], bool]

(location, is_default) -- the [x, y] anchor and a flag that is True when location was unset (the top-left axes-fraction default), which drives the transform and vertical alignment in draw.

Examples:

  • An unset label auto-anchors top-left; an explicit one is kept:
    >>> from cleopatra.glyphs.gridded.array_glyph import FrameLabel
    >>> FrameLabel().resolve_location()
    ([0.02, 0.95], True)
    >>> FrameLabel(location=[0.3, 0.4]).resolve_location()
    ([0.3, 0.4], False)
    
Source code in src/cleopatra/glyphs/gridded/array_glyph.py
def resolve_location(self) -> tuple[list[float], bool]:
    """Resolve the label anchor and whether it is the auto default.

    Returns:
        tuple: `(location, is_default)` -- the `[x, y]` anchor and a flag
            that is `True` when `location` was unset (the top-left
            axes-fraction default), which drives the transform and vertical
            alignment in `draw`.

    Examples:
        - An unset label auto-anchors top-left; an explicit one is kept:
            ```python
            >>> from cleopatra.glyphs.gridded.array_glyph import FrameLabel
            >>> FrameLabel().resolve_location()
            ([0.02, 0.95], True)
            >>> FrameLabel(location=[0.3, 0.4]).resolve_location()
            ([0.3, 0.4], False)

            ```
    """
    if self.location is None:
        return [0.02, 0.95], True
    return self.location, False

cleopatra.glyphs.gridded.array_glyph.Animation dataclass #

Playback options for ArrayGlyph.animate (grouped to keep the call small).

Bundles the animation-specific settings -- frame delay, the per-frame time label, the cell-value text colours, and the lazy frame source -- into one object, mirroring the other grouped-parameter objects. Pass an instance as animate(playback=Animation(...)); the render / colour options (color / contour / cells / classify / data_style / colorbar / ...) stay their own arguments, shared with plot.

Attributes:

Name Type Description
interval int

Delay between frames in milliseconds. Defaults to 200.

frame_label FrameLabel | None

Styling for the per-frame time label as a FrameLabel. None uses the default label placement / colour.

cell_value_text_colors tuple[str, str]

The two colours (low, high) for the cell-value text overlay, switched at the background threshold for contrast.

data_getter Callable[[int], ndarray] | None

Optional callable f(i) -> ndarray supplying frame i lazily (e.g. a NetCDF time slab), instead of holding the whole stack in memory. None iterates self.arr.

Examples:

  • Bundle a slower interval and a white-on-dark frame label:
    >>> from cleopatra.glyphs.gridded.array_glyph import Animation, FrameLabel
    >>> play = Animation(interval=500, frame_label=FrameLabel(color="white"))
    >>> play.interval
    500
    >>> play.frame_label.color
    'white'
    
Source code in src/cleopatra/glyphs/gridded/array_glyph.py
@dataclass(frozen=True)
class Animation:
    """Playback options for `ArrayGlyph.animate` (grouped to keep the call small).

    Bundles the animation-specific settings -- frame delay, the per-frame time
    label, the cell-value text colours, and the lazy frame source -- into one
    object, mirroring the other grouped-parameter objects. Pass an instance as
    `animate(playback=Animation(...))`; the render / colour options
    (`color` / `contour` / `cells` / `classify` / `data_style` / `colorbar` /
    ...) stay their own arguments, shared with `plot`.

    Attributes:
        interval: Delay between frames in milliseconds. Defaults to `200`.
        frame_label: Styling for the per-frame time label as a `FrameLabel`.
            `None` uses the default label placement / colour.
        cell_value_text_colors: The two colours (low, high) for the cell-value
            text overlay, switched at the background threshold for contrast.
        data_getter: Optional callable `f(i) -> ndarray` supplying frame `i`
            lazily (e.g. a NetCDF time slab), instead of holding the whole
            stack in memory. `None` iterates `self.arr`.

    Examples:
        - Bundle a slower interval and a white-on-dark frame label:
            ```python
            >>> from cleopatra.glyphs.gridded.array_glyph import Animation, FrameLabel
            >>> play = Animation(interval=500, frame_label=FrameLabel(color="white"))
            >>> play.interval
            500
            >>> play.frame_label.color
            'white'

            ```
    """

    interval: int = 200
    frame_label: FrameLabel | None = None
    cell_value_text_colors: tuple[str, str] = ("white", "black")
    data_getter: Callable[[int], np.ndarray] | None = None

cleopatra.glyphs.gridded.array_glyph.PanelLabels #

Per-panel title labels for the axes of an ArrayGlyph.facet grid.

Bundles the two coordinate-label sequences (col, row) that facet previously accepted as separate col_coords / row_coords arguments. Pass an instance as facet(labels=...) instead of the individual keywords. Each sequence supplies one label per slice along its facet axis; when given, the per-subplot title (and FacetGrid.name_dicts) uses that label instead of the integer slice index.

Attributes:

Name Type Description
col

Labels for the column-facet axis, by default None (titles use the integer index). When given, its length must match the column axis size of the stack.

row

Labels for the row-facet axis, by default None. Only honoured on a 4-D (row+col) facet; when given, its length must match the row axis size.

Examples:

  • A bare instance leaves both axes unlabelled (titles fall back to the integer slice index):
    >>> from cleopatra.glyphs.gridded.array_glyph import PanelLabels
    >>> labels = PanelLabels()
    >>> (labels.col, labels.row)
    (None, None)
    
  • Label the columns of a 3-D stack and read them back off the grid:
    >>> import numpy as np
    >>> from cleopatra.glyphs.gridded.array_glyph import (
    ...     ArrayGlyph,
    ...     FacetLayout,
    ...     PanelLabels,
    ... )
    >>> stack = np.arange(3 * 5 * 5, dtype=float).reshape(3, 5, 5)
    >>> labels = PanelLabels(col=["Jan", "Feb", "Mar"])
    >>> g = ArrayGlyph(stack).facet(FacetLayout(col="month", labels=labels))
    >>> g.name_dicts[0]
    {'month': 'Jan'}
    
  • Label both axes of a 4-D stack; each panel's name_dict carries the coordinate for both facet dimensions:
    >>> import numpy as np
    >>> from cleopatra.glyphs.gridded.array_glyph import (
    ...     ArrayGlyph,
    ...     FacetLayout,
    ...     PanelLabels,
    ... )
    >>> stack = np.arange(2 * 2 * 4 * 4, dtype=float).reshape(2, 2, 4, 4)
    >>> labels = PanelLabels(col=["A", "B"], row=[10, 20])
    >>> g = ArrayGlyph(stack).facet(
    ...     FacetLayout(col="t", row="lev", labels=labels)
    ... )
    >>> g.name_dicts[0]
    {'t': 'A', 'lev': 10}
    
Source code in src/cleopatra/glyphs/gridded/array_glyph.py
class PanelLabels:
    """Per-panel title labels for the axes of an `ArrayGlyph.facet` grid.

    Bundles the two coordinate-label sequences (`col`, `row`) that `facet`
    previously accepted as separate `col_coords` / `row_coords` arguments.
    Pass an instance as `facet(labels=...)` instead of the individual
    keywords. Each sequence supplies one label per slice along its facet
    axis; when given, the per-subplot title (and `FacetGrid.name_dicts`)
    uses that label instead of the integer slice index.

    Attributes:
        col: Labels for the column-facet axis, by default `None` (titles
            use the integer index). When given, its length must match the
            column axis size of the stack.
        row: Labels for the row-facet axis, by default `None`. Only
            honoured on a 4-D (row+col) facet; when given, its length must
            match the row axis size.

    Examples:
        - A bare instance leaves both axes unlabelled (titles fall back to
            the integer slice index):
            ```python
            >>> from cleopatra.glyphs.gridded.array_glyph import PanelLabels
            >>> labels = PanelLabels()
            >>> (labels.col, labels.row)
            (None, None)

            ```
        - Label the columns of a 3-D stack and read them back off the grid:
            ```python
            >>> import numpy as np
            >>> from cleopatra.glyphs.gridded.array_glyph import (
            ...     ArrayGlyph,
            ...     FacetLayout,
            ...     PanelLabels,
            ... )
            >>> stack = np.arange(3 * 5 * 5, dtype=float).reshape(3, 5, 5)
            >>> labels = PanelLabels(col=["Jan", "Feb", "Mar"])
            >>> g = ArrayGlyph(stack).facet(FacetLayout(col="month", labels=labels))
            >>> g.name_dicts[0]
            {'month': 'Jan'}

            ```
        - Label both axes of a 4-D stack; each panel's `name_dict` carries
            the coordinate for both facet dimensions:
            ```python
            >>> import numpy as np
            >>> from cleopatra.glyphs.gridded.array_glyph import (
            ...     ArrayGlyph,
            ...     FacetLayout,
            ...     PanelLabels,
            ... )
            >>> stack = np.arange(2 * 2 * 4 * 4, dtype=float).reshape(2, 2, 4, 4)
            >>> labels = PanelLabels(col=["A", "B"], row=[10, 20])
            >>> g = ArrayGlyph(stack).facet(
            ...     FacetLayout(col="t", row="lev", labels=labels)
            ... )
            >>> g.name_dicts[0]
            {'t': 'A', 'lev': 10}

            ```
    """

    def __init__(
        self,
        *,
        col: Sequence[Any] | None = None,
        row: Sequence[Any] | None = None,
    ) -> None:
        """Initialise a `PanelLabels`.

        Args:
            col: Labels for the column-facet axis, by default `None`
                (titles fall back to the integer slice index).
            row: Labels for the row-facet axis, by default `None`; only
                honoured on a 4-D (row+col) facet.
        """
        self.col = col
        self.row = row

    def validate(self, n_col: int, n_row: int | None = None) -> None:
        """Check the label sequences match the facet axis sizes.

        Args:
            n_col: Size of the column-facet axis.
            n_row: Size of the row-facet axis, or `None` for a col-only facet.

        Raises:
            ValueError: If `col` (or `row`) is set and its length does not
                match the corresponding axis size.

        Examples:
            - Matching lengths pass; a mismatch is rejected:
                ```python
                >>> from cleopatra.glyphs.gridded.array_glyph import PanelLabels
                >>> PanelLabels(col=["a", "b"]).validate(2)
                >>> PanelLabels(col=["a", "b"]).validate(3)
                Traceback (most recent call last):
                    ...
                ValueError: `labels.col` length 2 does not match the column axis size 3.

                ```
        """
        if self.col is not None and len(self.col) != n_col:
            raise ValueError(
                f"`labels.col` length {len(self.col)} does not match "
                f"the column axis size {n_col}."
            )
        if n_row is not None and self.row is not None and len(self.row) != n_row:
            raise ValueError(
                f"`labels.row` length {len(self.row)} does not match "
                f"the row axis size {n_row}."
            )

    def label_for(self, axis: Literal["col", "row"], index: int) -> Any:
        """Return the display label for a facet panel along `axis`.

        Falls back to the integer `index` when that axis has no labels -- the
        field-only half of a panel's title.

        Args:
            axis: Which facet axis, `"col"` or `"row"`.
            index: Zero-based slice index of the panel along that axis.

        Returns:
            The configured label at `index`, or `index` itself when that axis
            has no labels.

        Examples:
            - A configured label vs the integer-index fallback:
                ```python
                >>> from cleopatra.glyphs.gridded.array_glyph import PanelLabels
                >>> PanelLabels(col=["Jan", "Feb"]).label_for("col", 1)
                'Feb'
                >>> PanelLabels().label_for("col", 2)
                2

                ```
        """
        coords = self.col if axis == "col" else self.row
        return coords[index] if coords is not None else index

    def panel_title(
        self,
        col_dim: str,
        col_idx: int,
        row_dim: str | None = None,
        row_idx: int | None = None,
    ) -> tuple[str, dict]:
        """Build a panel's title string and `name_dict` from the facet indices.

        Args:
            col_dim: Name of the column dimension (the `col` argument to
                `facet`).
            col_idx: Zero-based column-slice index of the panel.
            row_dim: Name of the row dimension, or `None` for a col-only
                (3-D) facet.
            row_idx: Zero-based row-slice index, or `None` for a col-only
                facet.

        Returns:
            tuple: `(title, name_dict)` -- the `"dim=label"` title and the
                `{dim_name: label}` mapping (both axes when `row_dim` is set).

        Examples:
            - A two-axis panel title and its coordinate mapping:
                ```python
                >>> from cleopatra.glyphs.gridded.array_glyph import PanelLabels
                >>> labels = PanelLabels(col=["Jan"], row=["North"])
                >>> labels.panel_title("month", 0, "region", 0)
                ('month=Jan, region=North', {'month': 'Jan', 'region': 'North'})

                ```
        """
        col_label = self.label_for("col", col_idx)
        name_dict: dict[str, Any] = {col_dim: col_label}
        if row_dim is not None:
            row_label = self.label_for("row", cast(int, row_idx))
            name_dict[row_dim] = row_label
            title = f"{col_dim}={col_label}, {row_dim}={row_label}"
        else:
            title = f"{col_dim}={col_label}"
        return title, name_dict

__init__(*, col=None, row=None) #

Initialise a PanelLabels.

Parameters:

Name Type Description Default
col Sequence[Any] | None

Labels for the column-facet axis, by default None (titles fall back to the integer slice index).

None
row Sequence[Any] | None

Labels for the row-facet axis, by default None; only honoured on a 4-D (row+col) facet.

None
Source code in src/cleopatra/glyphs/gridded/array_glyph.py
def __init__(
    self,
    *,
    col: Sequence[Any] | None = None,
    row: Sequence[Any] | None = None,
) -> None:
    """Initialise a `PanelLabels`.

    Args:
        col: Labels for the column-facet axis, by default `None`
            (titles fall back to the integer slice index).
        row: Labels for the row-facet axis, by default `None`; only
            honoured on a 4-D (row+col) facet.
    """
    self.col = col
    self.row = row

label_for(axis, index) #

Return the display label for a facet panel along axis.

Falls back to the integer index when that axis has no labels -- the field-only half of a panel's title.

Parameters:

Name Type Description Default
axis Literal['col', 'row']

Which facet axis, "col" or "row".

required
index int

Zero-based slice index of the panel along that axis.

required

Returns:

Type Description
Any

The configured label at index, or index itself when that axis

Any

has no labels.

Examples:

  • A configured label vs the integer-index fallback:
    >>> from cleopatra.glyphs.gridded.array_glyph import PanelLabels
    >>> PanelLabels(col=["Jan", "Feb"]).label_for("col", 1)
    'Feb'
    >>> PanelLabels().label_for("col", 2)
    2
    
Source code in src/cleopatra/glyphs/gridded/array_glyph.py
def label_for(self, axis: Literal["col", "row"], index: int) -> Any:
    """Return the display label for a facet panel along `axis`.

    Falls back to the integer `index` when that axis has no labels -- the
    field-only half of a panel's title.

    Args:
        axis: Which facet axis, `"col"` or `"row"`.
        index: Zero-based slice index of the panel along that axis.

    Returns:
        The configured label at `index`, or `index` itself when that axis
        has no labels.

    Examples:
        - A configured label vs the integer-index fallback:
            ```python
            >>> from cleopatra.glyphs.gridded.array_glyph import PanelLabels
            >>> PanelLabels(col=["Jan", "Feb"]).label_for("col", 1)
            'Feb'
            >>> PanelLabels().label_for("col", 2)
            2

            ```
    """
    coords = self.col if axis == "col" else self.row
    return coords[index] if coords is not None else index

panel_title(col_dim, col_idx, row_dim=None, row_idx=None) #

Build a panel's title string and name_dict from the facet indices.

Parameters:

Name Type Description Default
col_dim str

Name of the column dimension (the col argument to facet).

required
col_idx int

Zero-based column-slice index of the panel.

required
row_dim str | None

Name of the row dimension, or None for a col-only (3-D) facet.

None
row_idx int | None

Zero-based row-slice index, or None for a col-only facet.

None

Returns:

Name Type Description
tuple tuple[str, dict]

(title, name_dict) -- the "dim=label" title and the {dim_name: label} mapping (both axes when row_dim is set).

Examples:

  • A two-axis panel title and its coordinate mapping:
    >>> from cleopatra.glyphs.gridded.array_glyph import PanelLabels
    >>> labels = PanelLabels(col=["Jan"], row=["North"])
    >>> labels.panel_title("month", 0, "region", 0)
    ('month=Jan, region=North', {'month': 'Jan', 'region': 'North'})
    
Source code in src/cleopatra/glyphs/gridded/array_glyph.py
def panel_title(
    self,
    col_dim: str,
    col_idx: int,
    row_dim: str | None = None,
    row_idx: int | None = None,
) -> tuple[str, dict]:
    """Build a panel's title string and `name_dict` from the facet indices.

    Args:
        col_dim: Name of the column dimension (the `col` argument to
            `facet`).
        col_idx: Zero-based column-slice index of the panel.
        row_dim: Name of the row dimension, or `None` for a col-only
            (3-D) facet.
        row_idx: Zero-based row-slice index, or `None` for a col-only
            facet.

    Returns:
        tuple: `(title, name_dict)` -- the `"dim=label"` title and the
            `{dim_name: label}` mapping (both axes when `row_dim` is set).

    Examples:
        - A two-axis panel title and its coordinate mapping:
            ```python
            >>> from cleopatra.glyphs.gridded.array_glyph import PanelLabels
            >>> labels = PanelLabels(col=["Jan"], row=["North"])
            >>> labels.panel_title("month", 0, "region", 0)
            ('month=Jan, region=North', {'month': 'Jan', 'region': 'North'})

            ```
    """
    col_label = self.label_for("col", col_idx)
    name_dict: dict[str, Any] = {col_dim: col_label}
    if row_dim is not None:
        row_label = self.label_for("row", cast(int, row_idx))
        name_dict[row_dim] = row_label
        title = f"{col_dim}={col_label}, {row_dim}={row_label}"
    else:
        title = f"{col_dim}={col_label}"
    return title, name_dict

validate(n_col, n_row=None) #

Check the label sequences match the facet axis sizes.

Parameters:

Name Type Description Default
n_col int

Size of the column-facet axis.

required
n_row int | None

Size of the row-facet axis, or None for a col-only facet.

None

Raises:

Type Description
ValueError

If col (or row) is set and its length does not match the corresponding axis size.

Examples:

  • Matching lengths pass; a mismatch is rejected:
    >>> from cleopatra.glyphs.gridded.array_glyph import PanelLabels
    >>> PanelLabels(col=["a", "b"]).validate(2)
    >>> PanelLabels(col=["a", "b"]).validate(3)
    Traceback (most recent call last):
        ...
    ValueError: `labels.col` length 2 does not match the column axis size 3.
    
Source code in src/cleopatra/glyphs/gridded/array_glyph.py
def validate(self, n_col: int, n_row: int | None = None) -> None:
    """Check the label sequences match the facet axis sizes.

    Args:
        n_col: Size of the column-facet axis.
        n_row: Size of the row-facet axis, or `None` for a col-only facet.

    Raises:
        ValueError: If `col` (or `row`) is set and its length does not
            match the corresponding axis size.

    Examples:
        - Matching lengths pass; a mismatch is rejected:
            ```python
            >>> from cleopatra.glyphs.gridded.array_glyph import PanelLabels
            >>> PanelLabels(col=["a", "b"]).validate(2)
            >>> PanelLabels(col=["a", "b"]).validate(3)
            Traceback (most recent call last):
                ...
            ValueError: `labels.col` length 2 does not match the column axis size 3.

            ```
    """
    if self.col is not None and len(self.col) != n_col:
        raise ValueError(
            f"`labels.col` length {len(self.col)} does not match "
            f"the column axis size {n_col}."
        )
    if n_row is not None and self.row is not None and len(self.row) != n_row:
        raise ValueError(
            f"`labels.row` length {len(self.row)} does not match "
            f"the row axis size {n_row}."
        )

What's new#

  • plot(kind=...) — choose the renderer: "auto" (default — pcolormesh when coords= was given, otherwise imshow), "imshow", "pcolormesh", "contour", "contourf".
  • xarray-aligned colour kwargs (still loose, on the constructor and plot()): robust (clip vmin/vmax to the 2nd/98th percentile), center (symmetrise around a value, auto RdBu_r), extend (colorbar arrows), cbar_kwargs (forwarded to fig.colorbar). Discrete colour bins / contour edges moved onto the Contour group object — pass contour=Contour(levels=...).
  • plot(classify=Classify(scheme=..., k=...)) — colour the raster by discrete data classes (a choropleth for grids) with a stepped colorbar, using the same Classify object the scatter / vector / flow / polygon glyphs take. Named schemes ("quantiles", "equal_interval", "percentiles", "std_mean", "natural_breaks" / "fisher_jenks") or explicit edges (Classify(scheme=[0, 10, 50, 100, 500])), numpy only. facet / animate take the same classify= and resolve the classes once over the whole stack so every panel / frame shares them. scheme="categorical" is rejected for a raster.
  • ArrayGlyph(..., coords=(x, y)) — plot curvilinear / non-uniform grids (1-D cell centres or 2-D meshgrids); with kind="auto" this routes to pcolormesh. Mutually exclusive with extent.
  • ArrayGlyph.facet(FacetLayout(col=, row=, col_wrap=, labels=, figure_size=, axes=, extents=), *, kind=, colorbar=, color=, contour=, cells=, classify=, data_style=, compose=) — a grid of subplots from a 3-D (N, H, W) or 4-D (N, M, H, W) stack with one shared colour scale and colorbar. The grid layout (which dimension(s) to facet, wrapping, panel labels, per-panel extents, and the target figure/axes) is bundled into a FacetLayout; per-panel render options stay as facet keywords. Pass labels=PanelLabels(col=..., row=...) on the FacetLayout to title panels by coordinate value instead of the integer slice index, and axes= to draw the panels into axes you already created (see the axes= reference below).
  • animate(..., playback=Animation(data_getter=callable)) — the Animation object bundles the playback settings (interval, frame_label, cell_value_text_colors, data_getter); data_getter supplies each frame lazily (e.g. a NetCDF time slab) instead of holding the whole stack in memory.
  • The colour scale is chosen via the ColorScaling group objectplot(color=ColorScaling.power(gamma=...)), ColorScaling.sym_log(...), ColorScaling.log(), ColorScaling.midpoint(at=...), ColorScaling.boundary(bounds=...), etc. (the loose color_scale keyword was removed and now raises).

Changes from earlier versions

  • ArrayGlyph.plot() returns (fig, ax).
  • The cell-value count is exposed as num_domain_cells (previously no_elem, now removed).
  • ArrayGlyph(arr) on an all-NaN / fully-masked array raises ValueError instead of producing an unusable colour range.

Examples#

Basic array plot#

import numpy as np
from cleopatra.glyphs.gridded.array_glyph import ArrayGlyph

array = np.random.default_rng(0).random((10, 10))
glyph = ArrayGlyph(array)
fig, ax = glyph.plot()

Array Plot Example

Display cell values#

from cleopatra.styling.params import CellValues

fig, ax = glyph.plot(cells=CellValues(show=True))

Display Cell Values Example

Display points#

from cleopatra.glyphs.gridded.array_glyph import PointOverlay

# [value, row, col] per point
points = np.array([[1, 2, 3], [2, 5, 7], [3, 8, 1]])
fig, ax = glyph.plot(points=PointOverlay(points))

Display Points Example

Render kinds and xarray-style colour kwargs#

import numpy as np
from cleopatra.glyphs.gridded.array_glyph import ArrayGlyph
from cleopatra.styling.params import Contour

data = np.linspace(-3.0, 8.0, 25).reshape(5, 5)

# filled contours, discretised into 6 levels, colorbar arrows on both ends
fig, ax = ArrayGlyph(data).plot(kind="contourf", contour=Contour(levels=6), extend="both")

# centre a diverging colormap on 0 (auto RdBu_r), clip outliers (robust)
fig, ax = ArrayGlyph(data).plot(center=0.0, robust=True)

Classified raster (choropleth)#

import numpy as np
from cleopatra.glyphs.gridded.array_glyph import ArrayGlyph
from cleopatra.styling.params import Classify

field = np.arange(100.0).reshape(10, 10)

# five equal-count classes with a stepped colorbar
fig, ax = ArrayGlyph(field).plot(classify=Classify(scheme="quantiles", k=5))

# native Fisher-Jenks natural breaks (numpy only, no mapclassify)
fig, ax = ArrayGlyph(field).plot(classify=Classify(scheme="natural_breaks", k=7))

# explicit class edges (e.g. hazard bands), used verbatim
fig, ax = ArrayGlyph(field).plot(classify=Classify(scheme=[0, 10, 50, 100, 500]))

Curvilinear coordinates (pcolormesh)#

import numpy as np
from cleopatra.glyphs.gridded.array_glyph import ArrayGlyph

arr = np.arange(12, dtype=float).reshape(3, 4)
x = np.linspace(0.0, 10.0, 4)   # 1-D cell centres (cols)
y = np.linspace(0.0, 5.0, 3)    # 1-D cell centres (rows)
fig, ax = ArrayGlyph(arr, coords=(x, y)).plot(kind="auto")  # -> pcolormesh

Faceting a stack#

import numpy as np
from cleopatra.glyphs.gridded.array_glyph import ArrayGlyph, FacetLayout

stack = np.random.default_rng(0).random((6, 20, 20))
g = ArrayGlyph(stack).facet(FacetLayout(col="time", col_wrap=3), robust=True)
g.fig.savefig("facet.png")     # g.axes is a (2, 3) ndarray of Axes; g.cbar is shared

Draw into axes you already own by passing them on the FacetLayout (cleopatra keeps the shared colour scale but won't resize or close your figure):

import matplotlib.pyplot as plt
import numpy as np
from cleopatra.glyphs.gridded.array_glyph import ArrayGlyph, FacetLayout

stack = np.random.default_rng(0).random((6, 20, 20))
fig, axs = plt.subplots(2, 3, figsize=(14, 7))
g = ArrayGlyph(stack).facet(FacetLayout(col="time", col_wrap=3, axes=axs))
assert g.fig is fig and g.axes[0, 0] is axs[0, 0]

Animation#

import numpy as np
from cleopatra.glyphs.gridded.array_glyph import ArrayGlyph, Animation

time_series = np.stack([np.random.default_rng(i).random((10, 10)) for i in range(5)])
time_labels = ["t1", "t2", "t3", "t4", "t5"]

glyph = ArrayGlyph(time_series)
anim = glyph.animate(time=time_labels)
glyph.save_animation("animation.gif", fps=2)

# lazy frames: only frame i is materialised, on demand (playback bundles the settings)
template = np.empty((10, 10))                       # shape template only
glyph = ArrayGlyph(template)
glyph.animate(time=time_labels, playback=Animation(data_getter=lambda i: time_series[i]))

Animation Example