Geographic basemap methods (glyphs)#
The glyphs that plot geographic data — ArrayGlyph, MeshGlyph, VectorGlyph,
FlowGlyph, PolygonGlyph, and ScatterGlyph — inherit
cleopatra.basemap.geo.GeoMixin, which adds a settable crs property plus five
convenience methods that drop a basemap onto the glyph's own axes without
importing the standalone helpers:
crs— a validated coordinate-reference-system property (int EPSG code, CRS string, orNone); it defaults thecrs=ofadd_tiles/add_featureswhen you omit it, and is validated on assignment.add_tiles→cleopatra.basemap.tiles.add_tilesadd_features→cleopatra.basemap.reference.add_featuresadd_relief→cleopatra.basemap.reference.add_reliefadd_reference_map— a one-call CAMS-style reference-map preset ("light","dark", or"auto"): grey coastlines + borders, a dashed lon/lat graticule, °W/°N labels, and a subtle frame.add_labels→cleopatra.basemap.geo.add_point_labels(dot + text markers for named points, e.g. cities).
Each basemap method is a thin wrapper: it draws on self.ax (the axes produced
when you plot the glyph) and forwards its arguments to the matching standalone
function, which remains the single source of truth. Chart and statistical glyphs
(LineGlyph, HistogramGlyph, KDEGlyph) deliberately do not inherit
these geo-only methods.
The module also exposes the standalone add_point_labels and available_map_styles
functions and the REFERENCE_MAP_STYLES preset dict (copy or read it to build a
custom preset).
Usage#
import matplotlib
matplotlib.use("Agg")  # any backend
import numpy as np

from cleopatra.glyphs.primitives.scatter_glyph import ScatterGlyph

# A few cities as (lon, lat) points.
lon = np.array([-74.0, -0.1, 2.35, 13.4, 37.6, 139.7, 151.2])
lat = np.array([40.7, 51.5, 48.9, 52.5, 55.8, 35.7, -33.9])

glyph = ScatterGlyph(lon, lat, values=np.arange(len(lon)))
glyph.plot()                                       # plot your data first

glyph.add_features("coastline", "110m", colors="0.3")   # basemap, on glyph.ax
glyph.add_features("borders", "110m", colors="0.6")
glyph.ax.set_aspect("equal")                       # 1° lon == 1° lat
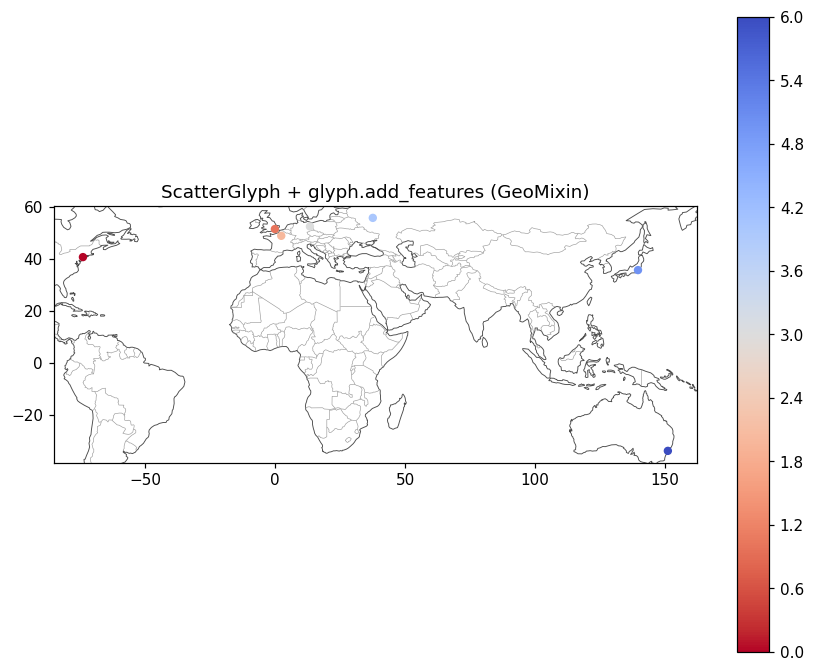
The standalone functions still work for plain matplotlib axes or non-geographic glyphs:
import matplotlib.pyplot as plt

from cleopatra.basemap.reference import add_features

fig, ax = plt.subplots()        # any matplotlib Axes
ax.set_xlim(-180, 180)
ax.set_ylim(-90, 90)
ax.set_aspect("equal")
add_features(ax, "coastline", "110m")
Note
Call these after plotting (so the glyph has an axes), or pass an explicit
ax=. add_relief and crs= reprojection require the cleopatra[tiles]
extra; drawing vector layers in EPSG:4326 needs only numpy + matplotlib.
Module Documentation#
cleopatra.basemap.geo
#
Geographic basemap convenience methods for glyphs.
GeoMixin adds three convenience methods -- add_tiles, add_features,
and add_relief -- to the glyph classes that plot geographic data, so a
basemap can be dropped under a plot without importing the standalone
helpers and without repeating the axes:
>>> glyph.plot()                 # doctest: +SKIP
>>> glyph.add_relief("low")      # doctest: +SKIP
>>> glyph.add_features("coastline", "50m")  # doctest: +SKIP
Each method is a thin wrapper that draws on the glyph's own axes
(self.ax) and delegates to the single implementation in
cleopatra.basemap.tiles / cleopatra.basemap.reference. The standalone functions remain
the source of truth; this mixin only removes the import + explicit-axes
boilerplate for the geographic glyphs (ArrayGlyph, MeshGlyph,
VectorGlyph, FlowGlyph, PolygonGlyph, ScatterGlyph). Non-geographic
glyphs (line/bar charts, statistical plots) deliberately do not inherit
it.
Importing this module (and the cleopatra.basemap.tiles / cleopatra.basemap.reference
modules it calls) does not require the optional cleopatra[tiles] extra:
those modules gate their [tiles] dependencies (pyproj, Pillow, ...)
behind their own internal lazy imports, so the extra is only needed when
a basemap is actually drawn.
Basemap
#
Structured spec for ArrayGlyph.plot / animate's basemap=.
Bundles the reference-backdrop choices -- the hypsometric relief drawn
under the data, the Natural Earth feature layers drawn over it, and the
opt-in alignment check -- into one value, mirroring ColorBar /
FrameLabel. plot/animate still accept basemap=True (the default
backdrop), a plain dict, or a callable f(glyph); a Basemap is the
typed, validated form, and _draw_basemap consumes any of them.
Attributes:
| Name | Type | Description |
|---|---|---|
relief |
The hypsometric relief drawn under the data ( |
|
features |
The Natural Earth layers drawn over the relief
( |
|
resolution |
Natural Earth resolution for the features ( |
|
check_alignment |
Run the opt-in mis-georeferencing check
( |
Examples:
- The default backdrop, spelled out:
- A "dark ocean" basemap -- no relief, a thin coastline + borders:
Source code in src/cleopatra/basemap/geo.py
379 380 381 382 383 384 385 386 387 388 389 390 391 392 393 394 395 396 397 398 399 400 401 402 403 404 405 406 407 408 409 410 411 412 413 414 415 416 417 418 419 420 421 422 423 424 425 426 427 428 429 430 431 432 433 434 435 436 437 438 439 440 441 442 443 444 445 446 447 448 449 450 451 452 453 454 455 456 457 458 459 460 461 462 463 464 465 466 467 468 469 470 471 472 473 474 475 476 477 478 479 480 | |
__init__(*, relief=True, features=None, resolution='50m', check_alignment=False)
#
Initialise a Basemap.
Parameters:
| Name | Type | Description | Default |
|---|---|---|---|
relief
|
bool | str | dict
|
Relief backdrop -- |
True
|
features
|
Iterable[Feature | str | tuple] | None
|
Layers over the relief -- an iterable of |
None
|
resolution
|
str
|
Natural Earth resolution for the features, by default
|
'50m'
|
check_alignment
|
bool
|
Opt-in mis-georeferencing check, by default
|
False
|
Raises:
| Type | Description |
|---|---|
ValueError
|
If |
Source code in src/cleopatra/basemap/geo.py
Feature
#
A Natural Earth reference layer for a Basemap.
Pairs a layer name with its matplotlib style keywords, so a Basemap's
features list reads as typed values instead of raw (name, dict)
tuples. The style keywords are forwarded verbatim to
GeoMixin.add_features (e.g. colors, linewidths, facecolor,
alpha, zorder).
Attributes:
| Name | Type | Description |
|---|---|---|
layer |
The Natural Earth layer to draw -- one of
|
|
style |
The style keywords forwarded to |
Examples:
- A thin grey coastline:
- An unknown layer is rejected at construction:
Source code in src/cleopatra/basemap/geo.py
__init__(layer, **style)
#
Initialise a Feature.
Parameters:
| Name | Type | Description | Default |
|---|---|---|---|
layer
|
str
|
Natural Earth layer name (see
|
required |
**style
|
Any
|
Style keywords forwarded to |
{}
|
Raises:
| Type | Description |
|---|---|
ValueError
|
If |
Source code in src/cleopatra/basemap/geo.py
GeoMixin
#
Mixin giving geographic glyphs add_tiles / add_features / add_relief.
The host class is expected to expose the plotted axes as self.ax
(every cleopatra.glyphs.base.glyph.Glyph subclass does). Call these after
plotting, or pass ax= explicitly.
Set self.crs to the CRS of the data plotted on the axes (an EPSG code
or CRS string) and add_features / add_tiles / add_relief default
their crs= argument to it, so the reference layer is placed in matching
coordinates without restating it on every call. An explicit crs= still
wins; leaving self.crs as None preserves each helper's own default.
For add_relief, a non-EPSG:4326 crs warps the relief raster into the
axis CRS (a 4326 axis places it in lon/lat, unchanged).
Source code in src/cleopatra/basemap/geo.py
483 484 485 486 487 488 489 490 491 492 493 494 495 496 497 498 499 500 501 502 503 504 505 506 507 508 509 510 511 512 513 514 515 516 517 518 519 520 521 522 523 524 525 526 527 528 529 530 531 532 533 534 535 536 537 538 539 540 541 542 543 544 545 546 547 548 549 550 551 552 553 554 555 556 557 558 559 560 561 562 563 564 565 566 567 568 569 570 571 572 573 574 575 576 577 578 579 580 581 582 583 584 585 586 587 588 589 590 591 592 593 594 595 596 597 598 599 600 601 602 603 604 605 606 607 608 609 610 611 612 613 614 615 616 617 618 619 620 621 622 623 624 625 626 627 628 629 630 631 632 633 634 635 636 637 638 639 640 641 642 643 644 645 646 647 648 649 650 651 652 653 654 655 656 657 658 659 660 661 662 663 664 665 666 667 668 669 670 671 672 673 674 675 676 677 678 679 680 681 682 683 684 685 686 687 688 689 690 691 692 693 694 695 696 697 698 699 700 701 702 703 704 705 706 707 708 709 710 711 712 713 714 715 716 717 718 719 720 721 722 723 724 725 726 727 728 729 730 731 732 733 734 735 736 737 738 739 740 741 742 743 744 745 746 747 748 749 750 751 752 753 754 755 756 757 758 759 760 761 762 763 764 765 766 767 768 769 770 771 772 773 774 775 776 777 778 779 780 781 782 783 784 785 786 787 788 789 790 791 792 793 794 795 796 797 798 799 800 801 802 803 804 805 806 807 808 809 810 811 812 813 814 815 816 817 818 819 820 821 822 823 824 825 826 827 828 829 830 831 832 833 834 835 836 837 838 839 840 841 842 843 844 845 846 847 848 849 850 851 852 853 854 855 856 857 858 859 860 861 862 863 864 865 866 867 868 869 870 871 872 873 874 875 876 877 878 879 880 881 882 883 884 885 886 887 888 889 890 891 892 893 894 895 896 897 898 899 900 901 902 903 904 905 906 907 908 909 910 911 912 913 914 915 916 917 918 919 920 921 922 923 924 925 926 927 928 929 930 931 932 933 934 935 936 937 938 939 940 941 942 943 944 945 946 947 948 949 950 951 952 953 954 955 956 957 958 959 960 961 962 963 964 965 966 967 968 969 970 971 972 973 974 975 976 977 978 979 980 981 982 983 984 985 986 987 988 989 990 991 992 993 994 995 996 997 998 999 1000 1001 1002 1003 1004 1005 1006 1007 1008 1009 1010 1011 1012 1013 1014 1015 1016 1017 1018 1019 1020 1021 1022 1023 1024 1025 1026 1027 1028 1029 1030 1031 1032 1033 1034 1035 1036 1037 1038 1039 1040 1041 1042 1043 1044 1045 1046 1047 1048 1049 1050 1051 1052 1053 1054 1055 1056 1057 1058 1059 1060 1061 1062 1063 1064 1065 1066 1067 1068 1069 1070 1071 1072 1073 1074 1075 1076 1077 1078 1079 1080 1081 1082 1083 1084 1085 1086 1087 1088 1089 1090 1091 1092 1093 1094 1095 1096 | |
crs
property
writable
#
CRS of the data plotted on self.ax (EPSG code or CRS string).
When set, add_features / add_tiles / add_relief default crs=
to it; None keeps each helper's own default. The value is validated on
assignment (see cleopatra.basemap.geo._validate_crs) so mistakes surface
at glyph.crs = ... rather than later, when a basemap is drawn.
Raises:
| Type | Description |
|---|---|
TypeError
|
If assigned something other than an int, str, or
|
ValueError
|
If assigned a non-positive EPSG code, an empty
string, or (when |
add_features(*args, ax=None, **kwargs)
#
Draw a Natural Earth reference layer on the glyph's axes.
Thin wrapper over cleopatra.basemap.reference.add_features; arguments are
forwarded unchanged (e.g. layer, resolution, crs, and style
keywords). When crs is omitted it defaults to self.crs.
Parameters:
| Name | Type | Description | Default |
|---|---|---|---|
*args
|
Any
|
Positional arguments for
|
()
|
ax
|
Any
|
Axes to draw on. Defaults to the glyph's |
None
|
**kwargs
|
Any
|
Keyword arguments for
|
{}
|
Returns:
| Type | Description |
|---|---|
Any
|
matplotlib.axes.Axes: The axes, for chaining. |
Raises:
| Type | Description |
|---|---|
RuntimeError
|
Only if there is no axes, no |
See Also
cleopatra.basemap.reference.add_features: The underlying implementation and its full parameter list.
Source code in src/cleopatra/basemap/geo.py
add_labels(points, *, ax=None, **kwargs)
#
Annotate named points on the glyph's axes with a dot + label.
Thin wrapper over cleopatra.basemap.geo.add_point_labels; draws a plain
dot marker and text label per point, matching the minimalist
city-label look CAMS maps use. Points are plotted at whatever
coordinates the axes is already using -- plain lon/lat for a flat
map, or reprojected x/y for an orthographic globe.
Parameters:
| Name | Type | Description | Default |
|---|---|---|---|
points
|
dict[str, tuple[float, float]]
|
Mapping of label text to |
required |
ax
|
Any
|
Axes to draw on. Defaults to the glyph's |
None
|
**kwargs
|
Any
|
Forwarded to |
{}
|
Returns:
| Type | Description |
|---|---|
Any
|
matplotlib.axes.Axes: The axes, for chaining. |
Raises:
| Type | Description |
|---|---|
RuntimeError
|
Only if there is no axes, no |
Examples:
- Label a city on a plotted glyph:
See Also
cleopatra.basemap.geo.add_point_labels: The underlying implementation. add_reference_map: The full basemap-chrome preset this pairs with.
Source code in src/cleopatra/basemap/geo.py
add_reference_map(style='light', *, ax=None, extent=None, resolution=None, graticule_step=None, zorder=5)
#
Dress the glyph's axes in a weather-centre reference-map style.
One call composes the recipe that otherwise takes ~15 lines of
matplotlib after plot/animate: grey Natural Earth coastline
+ borders, a dashed lon/lat graticule, °W/°N degree labels,
and a subtle frame, plus -- for "dark" -- a dimmed relief
backdrop beneath the data. The chrome layers on top of the existing
data, so call it after plotting.
The map is drawn in the axes' current geographic coordinates. Pass
extent (or construct the glyph with extent=) so the axes are
georeferenced — otherwise the coastlines cannot align with the data
and a warning is emitted. Deriving that extent from a source dataset
is the caller's job (cleopatra renders supplied coordinates; it does
not read geotransforms).
Parameters:
| Name | Type | Description | Default |
|---|---|---|---|
style
|
str
|
A name from |
'light'
|
ax
|
Any
|
Axes to draw on. Defaults to the glyph's |
None
|
extent
|
Any
|
Optional |
None
|
resolution
|
str | None
|
Natural Earth resolution for the coastline/borders
( |
None
|
graticule_step
|
float | None
|
Degree spacing for the graticule. Defaults to a "nice" step giving ~6 divisions across the wider span. |
None
|
zorder
|
int
|
Draw order for the reference layers (drawn above the data; the graticule sits just below the coastlines). |
5
|
Returns:
| Type | Description |
|---|---|
Any
|
matplotlib.axes.Axes: The decorated axes, for chaining. |
Raises:
| Type | Description |
|---|---|
RuntimeError
|
Only if there is no axes, no |
ValueError
|
If |
Examples:
- Dress a georeferenced field in the operational look:
See Also
add_features: The Natural Earth layer helper this composes. available_map_styles: The built-in preset names.
Source code in src/cleopatra/basemap/geo.py
927 928 929 930 931 932 933 934 935 936 937 938 939 940 941 942 943 944 945 946 947 948 949 950 951 952 953 954 955 956 957 958 959 960 961 962 963 964 965 966 967 968 969 970 971 972 973 974 975 976 977 978 979 980 981 982 983 984 985 986 987 988 989 990 991 992 993 994 995 996 997 998 999 1000 1001 1002 1003 1004 1005 1006 1007 1008 1009 1010 1011 1012 1013 1014 1015 1016 1017 1018 1019 1020 1021 1022 1023 1024 1025 1026 1027 1028 1029 1030 1031 1032 1033 1034 1035 1036 1037 1038 1039 1040 1041 1042 1043 1044 1045 1046 1047 1048 1049 1050 1051 1052 1053 1054 1055 1056 1057 1058 1059 1060 1061 1062 1063 1064 1065 1066 1067 1068 1069 1070 1071 1072 1073 1074 1075 1076 1077 1078 1079 1080 1081 1082 1083 1084 1085 1086 1087 1088 1089 1090 1091 1092 1093 1094 1095 1096 | |
add_relief(*args, ax=None, **kwargs)
#
Draw a hypsometric relief backdrop under the glyph's data.
Thin wrapper over cleopatra.basemap.reference.add_relief; arguments are
forwarded unchanged (e.g. resolution, extent, alpha). When
crs is omitted it defaults to self.crs, so on a non-EPSG:4326
axis the relief is warped to match the data (an explicit crs= still
wins). Requires the cleopatra[tiles] extra (Pillow, and pyproj for a
non-4326 crs).
Parameters:
| Name | Type | Description | Default |
|---|---|---|---|
*args
|
Any
|
Positional arguments for
|
()
|
ax
|
Any
|
Axes to draw on. Defaults to the glyph's |
None
|
**kwargs
|
Any
|
Keyword arguments for
|
{}
|
Returns:
| Type | Description |
|---|---|
Any
|
matplotlib.axes.Axes: The axes, for chaining. |
Raises:
| Type | Description |
|---|---|
RuntimeError
|
Only if there is no axes, no |
See Also
cleopatra.basemap.reference.add_relief: The underlying implementation and its full parameter list.
Source code in src/cleopatra/basemap/geo.py
add_tiles(*args, ax=None, **kwargs)
#
Overlay a web-tile basemap on the glyph's axes.
Thin wrapper over cleopatra.basemap.tiles.add_tiles; positional and
keyword arguments are forwarded unchanged (e.g. source, crs,
zoom, alpha). When crs is omitted it defaults to self.crs.
Requires the cleopatra[tiles] extra.
Parameters:
| Name | Type | Description | Default |
|---|---|---|---|
*args
|
Any
|
Positional arguments for |
()
|
ax
|
Any
|
Axes to draw on. Defaults to the glyph's |
None
|
**kwargs
|
Any
|
Keyword arguments for |
{}
|
Returns:
| Type | Description |
|---|---|
Any
|
matplotlib.axes.Axes: The axes, for chaining. |
Raises:
| Type | Description |
|---|---|
RuntimeError
|
Only if there is no axes, no |
See Also
cleopatra.basemap.tiles.add_tiles: The underlying implementation and its full parameter list.
Source code in src/cleopatra/basemap/geo.py
add_point_labels(ax, points, *, color='white', marker_size=5.0, fontsize=9.0, offset=(4.0, 0.0), zorder=6)
#
Annotate named points with a plain dot marker + text label.
Draws a small circular marker at each point and a plain text label
beside it -- no halo, no bounding box -- matching the minimalist look
CAMS maps use for city labels. points are plotted at whatever
coordinates ax is already using (plain lon/lat on a flat axes, or
projected x/y on an orthographic globe -- reproject the points yourself,
e.g. with the same transformer cleopatra.basemap.projection.orthographic_grid
builds, before calling this on a globe view), so this composes with any
projection or colour styling; it makes no assumption about either.
Parameters:
| Name | Type | Description | Default |
|---|---|---|---|
ax
|
Any
|
Axes to draw on. |
required |
points
|
dict[str, tuple[float, float]]
|
Mapping of label text to |
required |
color
|
str
|
Colour for both the marker and the label text. |
'white'
|
marker_size
|
float
|
Marker size in points. |
5.0
|
fontsize
|
float
|
Label font size in points. |
9.0
|
offset
|
tuple[float, float]
|
|
(4.0, 0.0)
|
zorder
|
int
|
Draw order for both the marker and the label. |
6
|
Returns:
| Name | Type | Description |
|---|---|---|
Axes |
Any
|
The same |
Examples:
- Label two points and read back the drawn markers/labels:
>>> import matplotlib.pyplot as plt >>> from cleopatra.basemap.geo import add_point_labels >>> fig, ax = plt.subplots() >>> _ = add_point_labels(ax, {"London": (-0.1, 51.5), "Moscow": (37.6, 55.8)}) >>> len(ax.lines) # one marker per point 2 >>> [t.get_text() for t in ax.texts] ['London', 'Moscow'] >>> plt.close(fig) - An empty mapping draws nothing but still returns
ax, for chaining:
See Also
GeoMixin.add_labels: The glyph convenience wrapper for this function.
Source code in src/cleopatra/basemap/geo.py
240 241 242 243 244 245 246 247 248 249 250 251 252 253 254 255 256 257 258 259 260 261 262 263 264 265 266 267 268 269 270 271 272 273 274 275 276 277 278 279 280 281 282 283 284 285 286 287 288 289 290 291 292 293 294 295 296 297 298 299 300 301 302 303 304 305 306 307 308 309 310 311 312 313 314 315 316 317 318 319 320 321 322 | |
available_map_styles()
#
Return the built-in add_reference_map style names.
Returns:
| Type | Description |
|---|---|
list[str]
|
list[str]: The preset names accepted by |
list[str]
|
|
Examples:
>>> from cleopatra.basemap.geo import available_map_styles
>>> available_map_styles()
['light', 'dark']